

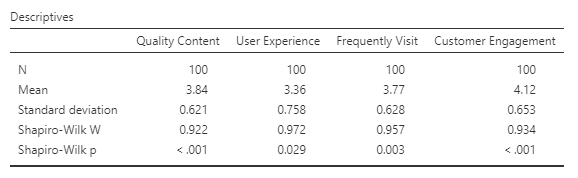
Question: Interpret this data like in a thesis or research. Question 3. Is your data parametric or non-parametric based on your normality test? Result: non-parametric because
Interpret this data like in a thesis or research.
Question 3. Is your data parametric or non-parametric based on your normality test?
Result: non-parametric because Shapiro-Wilk p is <.001>
Note: Please be based on the table
Step by Step Solution
There are 3 Steps involved in it
1 Expert Approved Answer
Step: 1 Unlock

Question Has Been Solved by an Expert!
Get step-by-step solutions from verified subject matter experts
Step: 2 Unlock
Step: 3 Unlock