

Question: Interpret this line chart N 1.5 1 0.5 -0.5 7 2/27/2023 -1.5 -Z 2/28/2028 3/1/2023 Daily returns 3/2/2023 -S&P 500 return Conservative portfolio 3/3/2023 3/4/2023
Interpret this line chart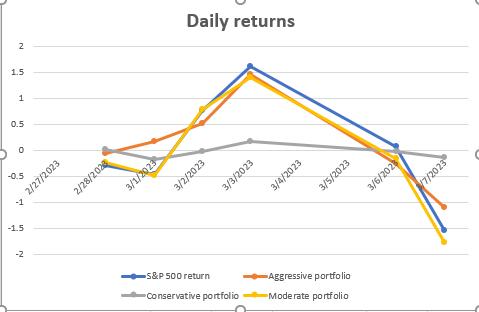
N 1.5 1 0.5 -0.5 7 2/27/2023 -1.5 -Z 2/28/2028 3/1/2023 Daily returns 3/2/2023 -S&P 500 return Conservative portfolio 3/3/2023 3/4/2023 3/5/2023 Aggressive portfolio Moderate portfolio 3/6/2023 17/2023
Step by Step Solution
★★★★★
3.45 Rating (145 Votes )
There are 3 Steps involved in it
1 Expert Approved Answer
Step: 1 Unlock

The line chart shows the daily returns for three different types of portfolios agg... View full answer
Question Has Been Solved by an Expert!
Get step-by-step solutions from verified subject matter experts
Step: 2 Unlock
Step: 3 Unlock