

Question: interpret this regression chart L M N Run the regression and put your output here . SUMMARY OUTPUT Regression Statistics Multiple R R Square Adjusted
interpret this regression chart 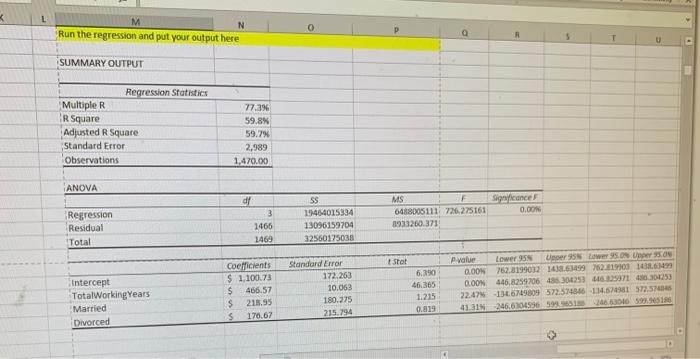
L M N Run the regression and put your output here . SUMMARY OUTPUT Regression Statistics Multiple R R Square Adjusted R Square Standard Error Observations 77.3% 59.8% 59.7 2,989 1,470.00 ANOVA Regression Residual Total df 3 1466 1469 SS 19464015334 13096159704 32560175038 MS F Significance 6488005111726275161 0.00 1933200.371 Star Intercept TotalWorking Years Married Divorced Coefficients $ 1,100.73 $ 466.57 $ 216.95 $ 178,67 Standard Error 172.263 10.063 180.275 215.794 6.390 46.365 1.215 0.019 P value Lower 95 Under 95N Lw95.08.09 0.00 762.8199032 14.63499 702159303 1438.647 0.00 4:46.8259706435304253 416335371 480.30,53 22.47 134.6749809 572.574866 114.524915725735 41.31N246.63045969990046.630105518 Step by Step Solution
There are 3 Steps involved in it
1 Expert Approved Answer
Step: 1 Unlock

Question Has Been Solved by an Expert!
Get step-by-step solutions from verified subject matter experts
Step: 2 Unlock
Step: 3 Unlock