

Question: Interpretation of real data and confidence intervals Table 3 Mean yield and RCA for all genotypes. 10.38 12.83 12.33 13.12 84 10.49 11.85 11.12 10.48
Interpretation of real data and confidence intervals
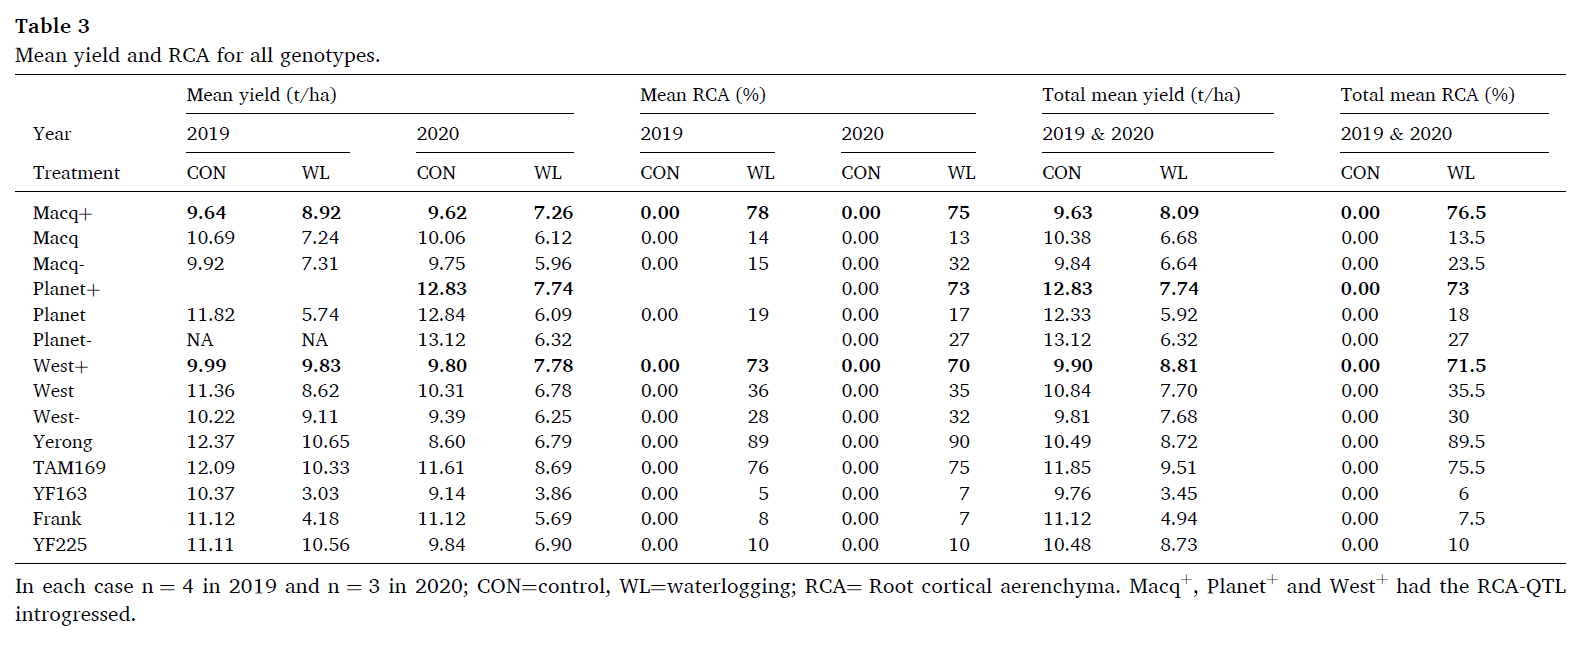
Table 3 Mean yield and RCA for all genotypes. 10.38 12.83 12.33 13.12 84 10.49 11.85 11.12 10.48 Mean yield (t/ha) 2020 CON 10.06 9.75 12.83 12.84 13.12 9.80 10.31 9.39 8.60 11.61 9.14 11.12 9.84 in 2020; CON Mean RCA (0/0) 2019 CON 7.26 6.12 5.96 7.74 6.09 6.32 7.78 6.78 6.25 6.79 8.69 3.86 5.69 6.90 control, 2020 CON 0.00 0.00 0.00 0.00 0.00 0.00 0.00 0.00 0.00 0.00 0.00 0.00 0.00 0.00 Total mean yield (t/ha) 2019 & 2020 CON Total mean RCA (%) 2019 & 2020 Year Treatment Macq+ Macq Macq Planet+ Planet Planet- West+ West West- Yerong TAM169 YF163 Frank YF225 In each case introgressed. 2019 CON 9.64 10.69 9.92 11.82 9.99 11.36 10.22 12.37 12.09 10.37 11.12 11.11 n 4 in 2019 8.92 7.24 7.31 5.74 9.83 8.62 9.11 10.65 10.33 3.03 4.18 10.56 and n 3 0.00 0.00 0.00 0.00 0.00 0.00 0.00 0.00 0.00 0.00 0.00 0.00 78 14 15 19 73 36 28 89 76 5 8 10 75 13 32 73 17 70 35 32 90 75 7 7 10 WL=waterlogging; RCA Root cortical 9.63 9.84 9.90 9.81 9.76 aerenchyma. 8.09 6.68 6.64 7.74 5.92 6.32 8.81 7.70 7.68 8.72 9.51 3.45 4.94 8.73 Macq , Planet and CON 0.00 0.00 0.00 0.00 0.00 0.00 0.00 0.00 0.00 0.00 0.00 0.00 0.00 0.00 West 76.5 13.5 23.5 73 18 71.5 35.5 30 89.5 75.5 6 7.5 10 had the RCA-QTL
Step by Step Solution
There are 3 Steps involved in it

Get step-by-step solutions from verified subject matter experts