

Question: Interpreting Graph of a Linear Program. Consider the linear program below and answer the following questions. LO 3 , 4 , 6 Max 2 A
Interpreting Graph of a Linear Program. Consider the linear program below and answer the following questions. LO
Max AB
St
a b Constraint
a b Constraint
a b Constraint
AB
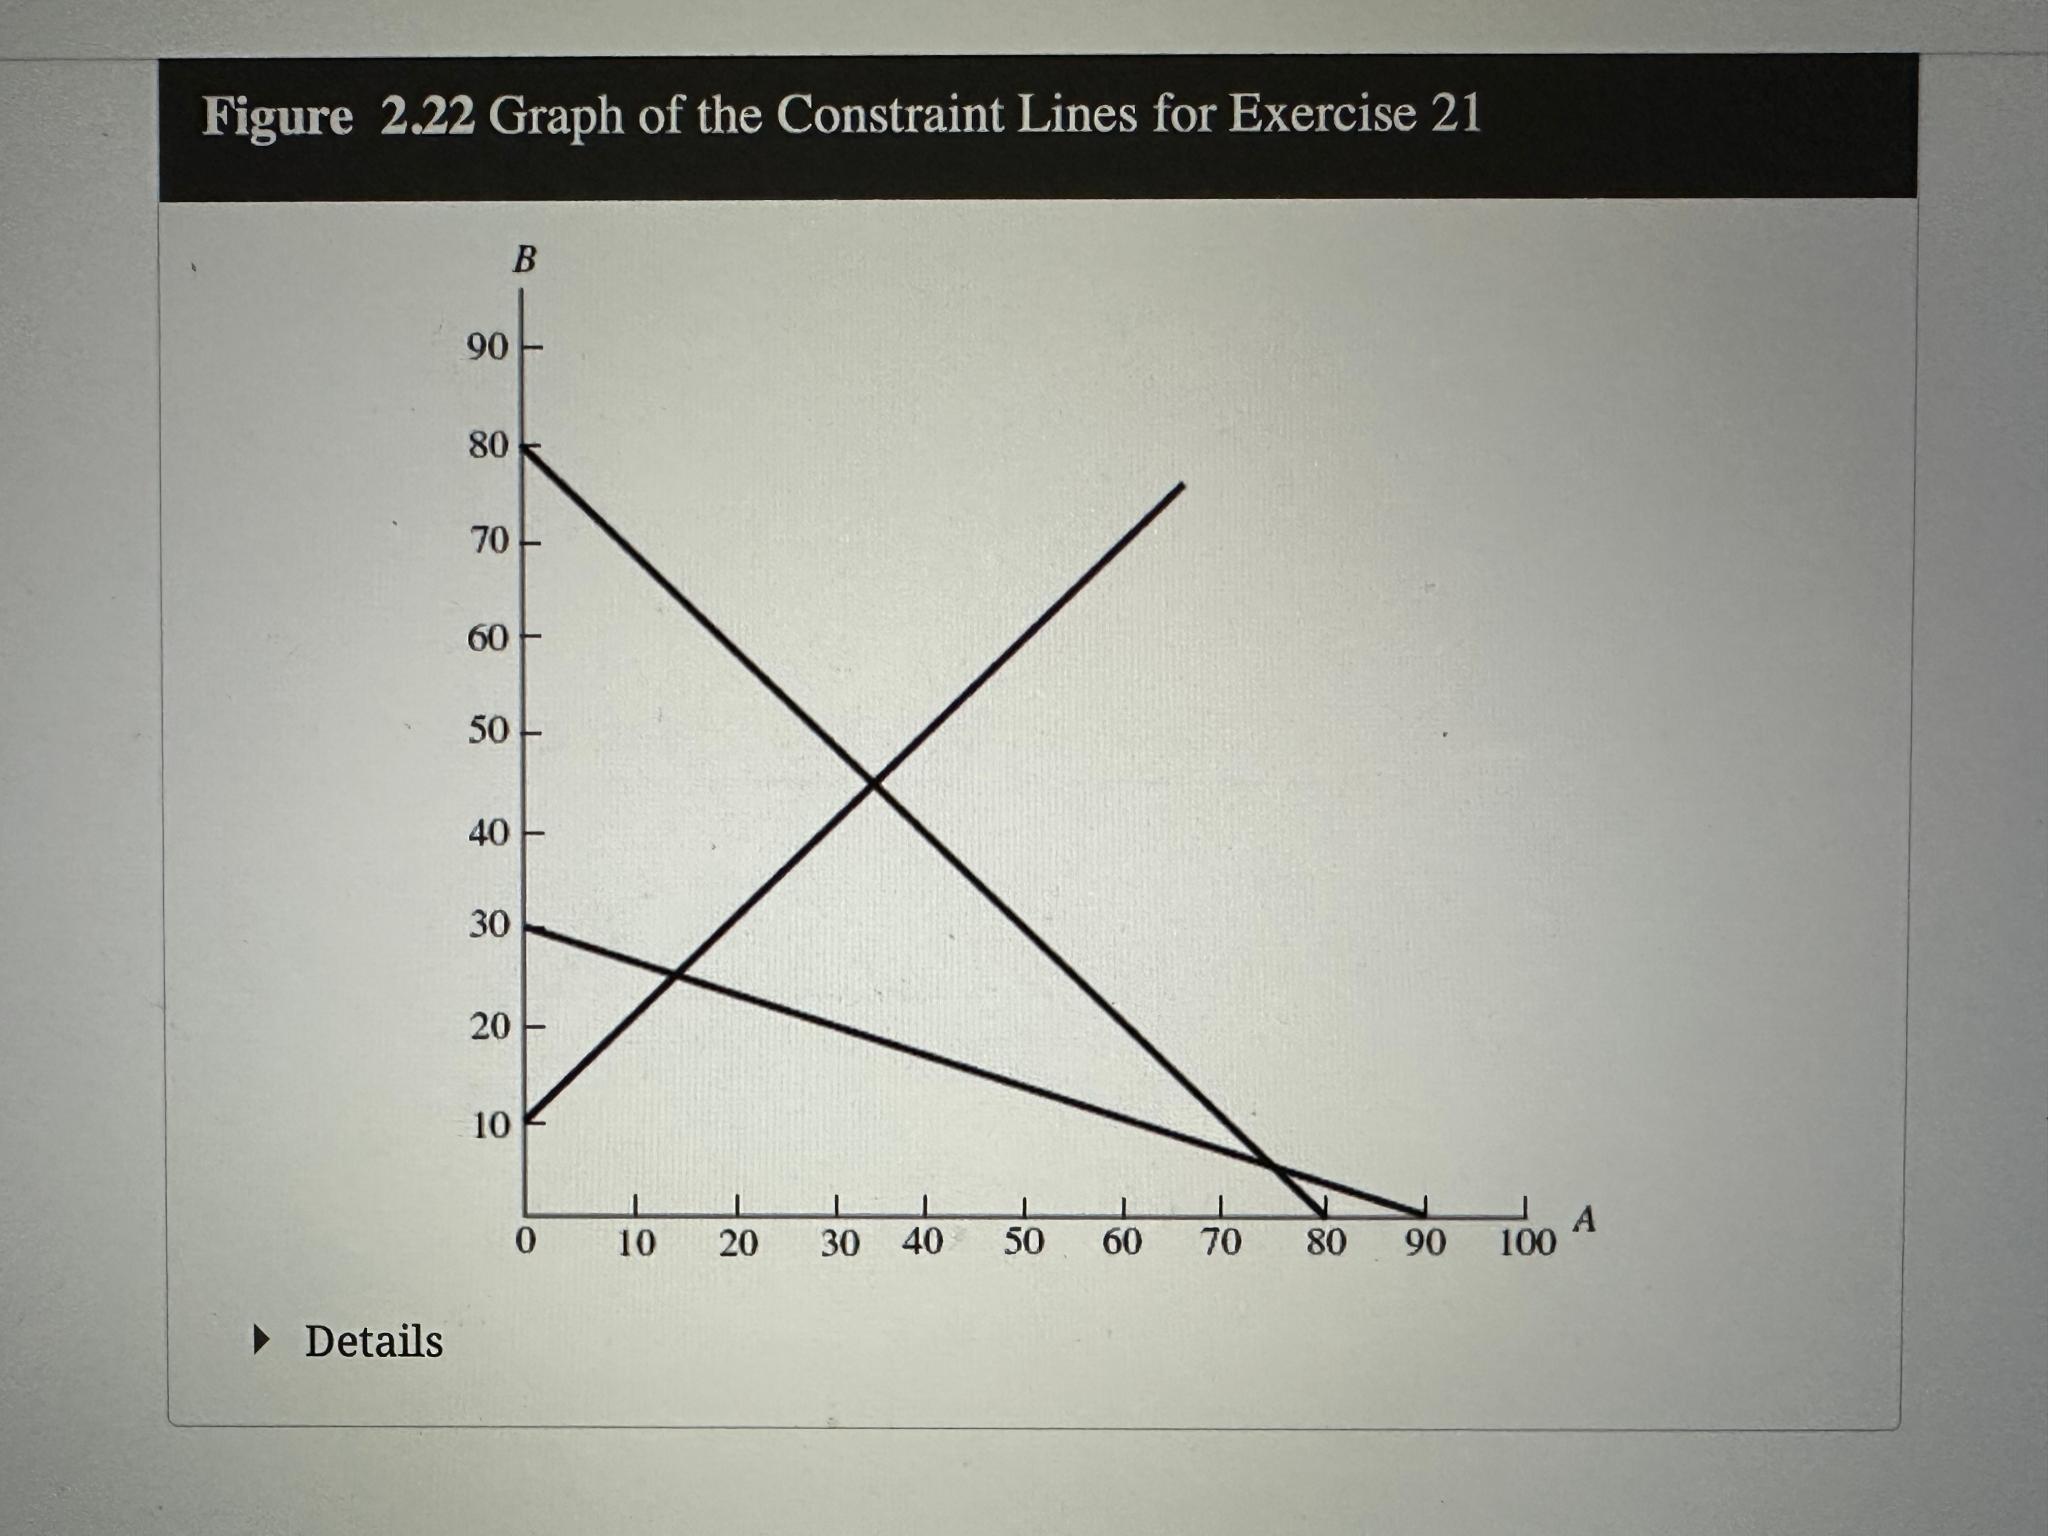
Place a number next to each constraint line to identify which constraint it represents.
Shade in the feasible region on the graph
Identify the optimal extreme point. What is the optimal solution?
Which constraints are binding? Explain.
How much slack or surplus is associated with the nonbinding constraint?
Step by Step Solution
There are 3 Steps involved in it
1 Expert Approved Answer
Step: 1 Unlock

Question Has Been Solved by an Expert!
Get step-by-step solutions from verified subject matter experts
Step: 2 Unlock
Step: 3 Unlock