

Question: Intervals (-00, - 1) (-1, 1/2) (1/2, 00) Test Value F(TV) Sign of f' (test value) Concave up/Concave downApply graphing strategies and sketch the graph


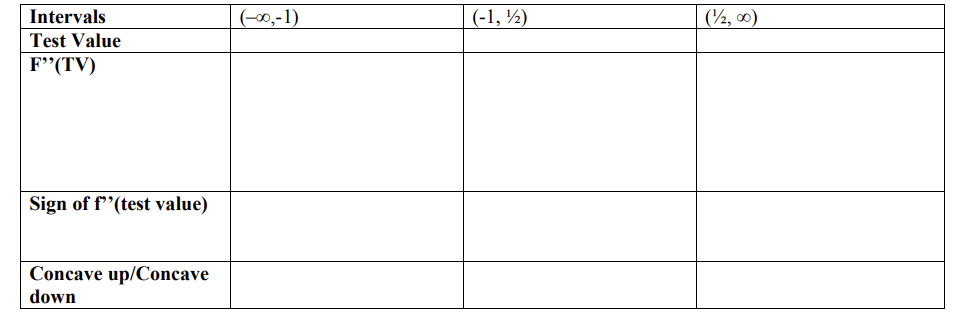
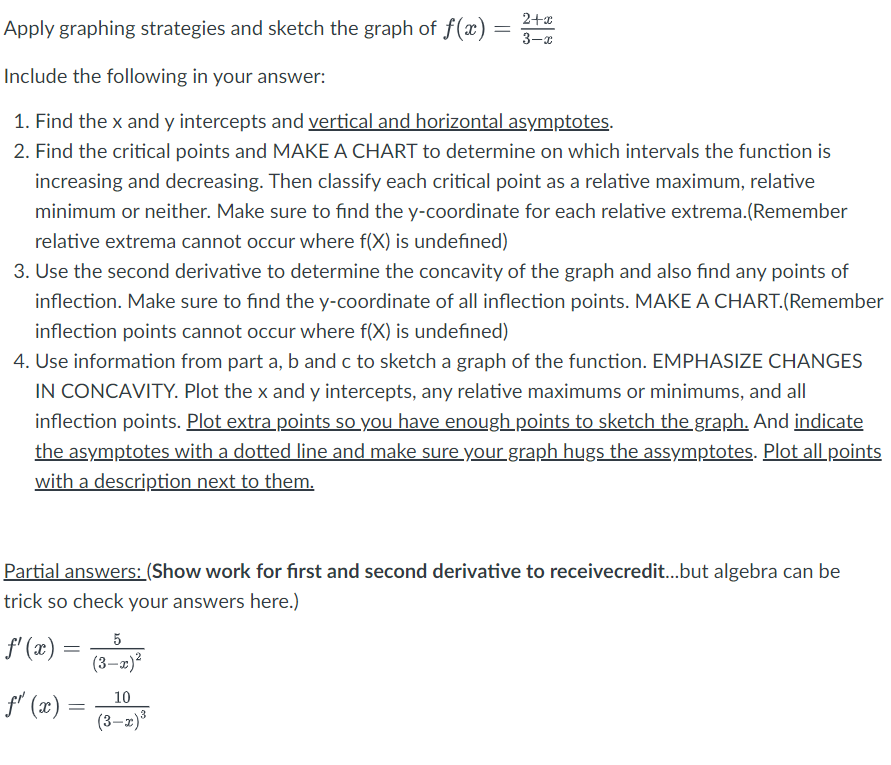
Intervals (-00, - 1) (-1, 1/2) (1/2, 00) Test Value F"(TV) Sign of f"' (test value) Concave up/Concave downApply graphing strategies and sketch the graph of f (ac) = Include the following in your answer: 1. Find the x and y intercepts and vertical and horizontal asymptotes. 2. Find the critical points and MAKE A CHART to determine on which intervals the function is increasing and decreasing. Then classify each critical point as a relative maximum, relative minimum or neither. Make sure to find the y-coordinate for each relative extrema.(Remember relative extrema cannot occur where f(X) is undefined) 3. Use the second derivative to determine the concavity of the graph and also find any points of inflection. Make sure to find the y-coordinate of all inflection points. MAKE A CHART.(Remember inflection points cannot occur where f(X) is undefined) 4. Use information from part a, b and c to sketch a graph of the function. EMPHASIZE CHANGES IN CONCAVITY. Plot the x and y intercepts, any relative maximums or minimums, and all inflection points. Plot extra points so you have enough points to sketch the graph. And indicate the asymptotes with a dotted line and make sure your graph hugs the assymptotes. Plot all points with a description next to them. Partial answers: (Show work for first and second derivative to receivecredit...but algebra can be trick so check your answers here.) f' (20) = 5 (3-2)2 f (ac) = 10 (3-z) 3
Step by Step Solution
There are 3 Steps involved in it

Get step-by-step solutions from verified subject matter experts