

Question: Intro to Stat I (STAT-145) In-Class Assignment 9: Least Squares Regression and Diagnostics 4. Shown below is the Minitab results of a survey comparing the

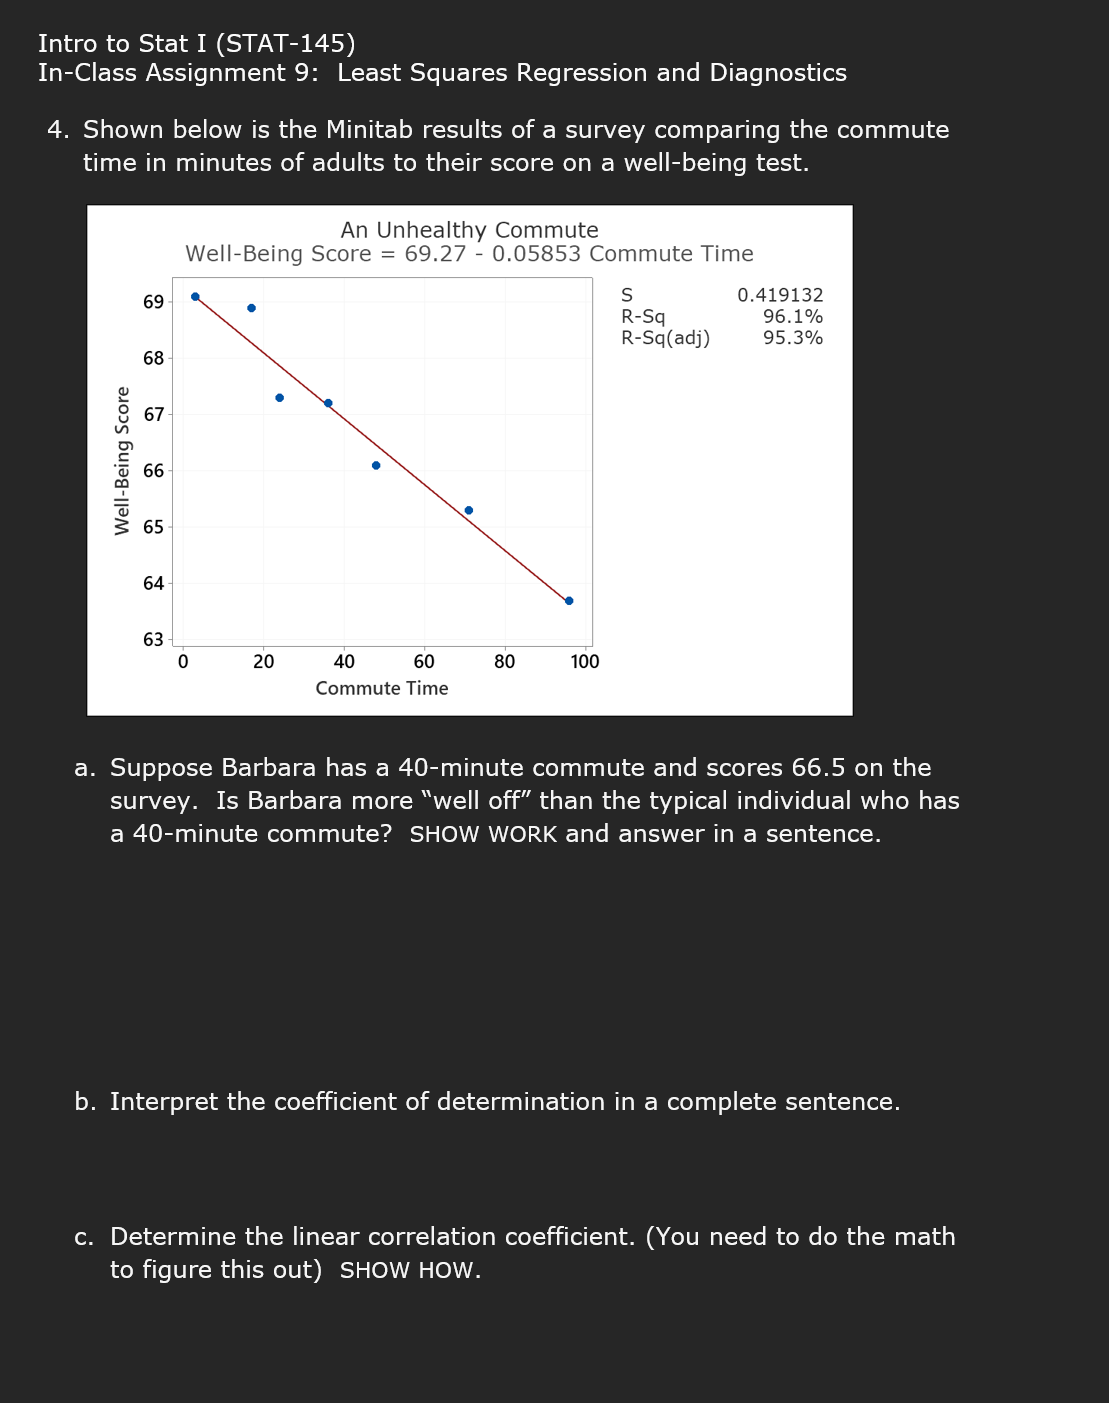
Intro to Stat I (STAT-145) In-Class Assignment 9: Least Squares Regression and Diagnostics 4. Shown below is the Minitab results of a survey comparing the commute time in minutes of adults to their score on a well-being test. An Unhealthy Commute WellBeing Score : 69.27 - 0.05853 Commute Time 5 0.419132 R~Sq 96.1% RSq(adj) 95.3% Well-Being Score 40 60 Commute Time a. Suppose Barbara has a 40-minute commute and scores 56.5 on the survey. Is Barbara more \"well off" than the typical individual who has a 40-minute commute? SHOW WORK and answer in a sentence. b. Interpret the coefficient of determination in a complete sentence. c. Determine the linear correlation coefficient. (You need to do the math to figure this out) SHOW HOW
Step by Step Solution
There are 3 Steps involved in it

Get step-by-step solutions from verified subject matter experts