Question: Introduction : Data analytics is not that new . What is new is big data , that is , entities are* etc accumulating
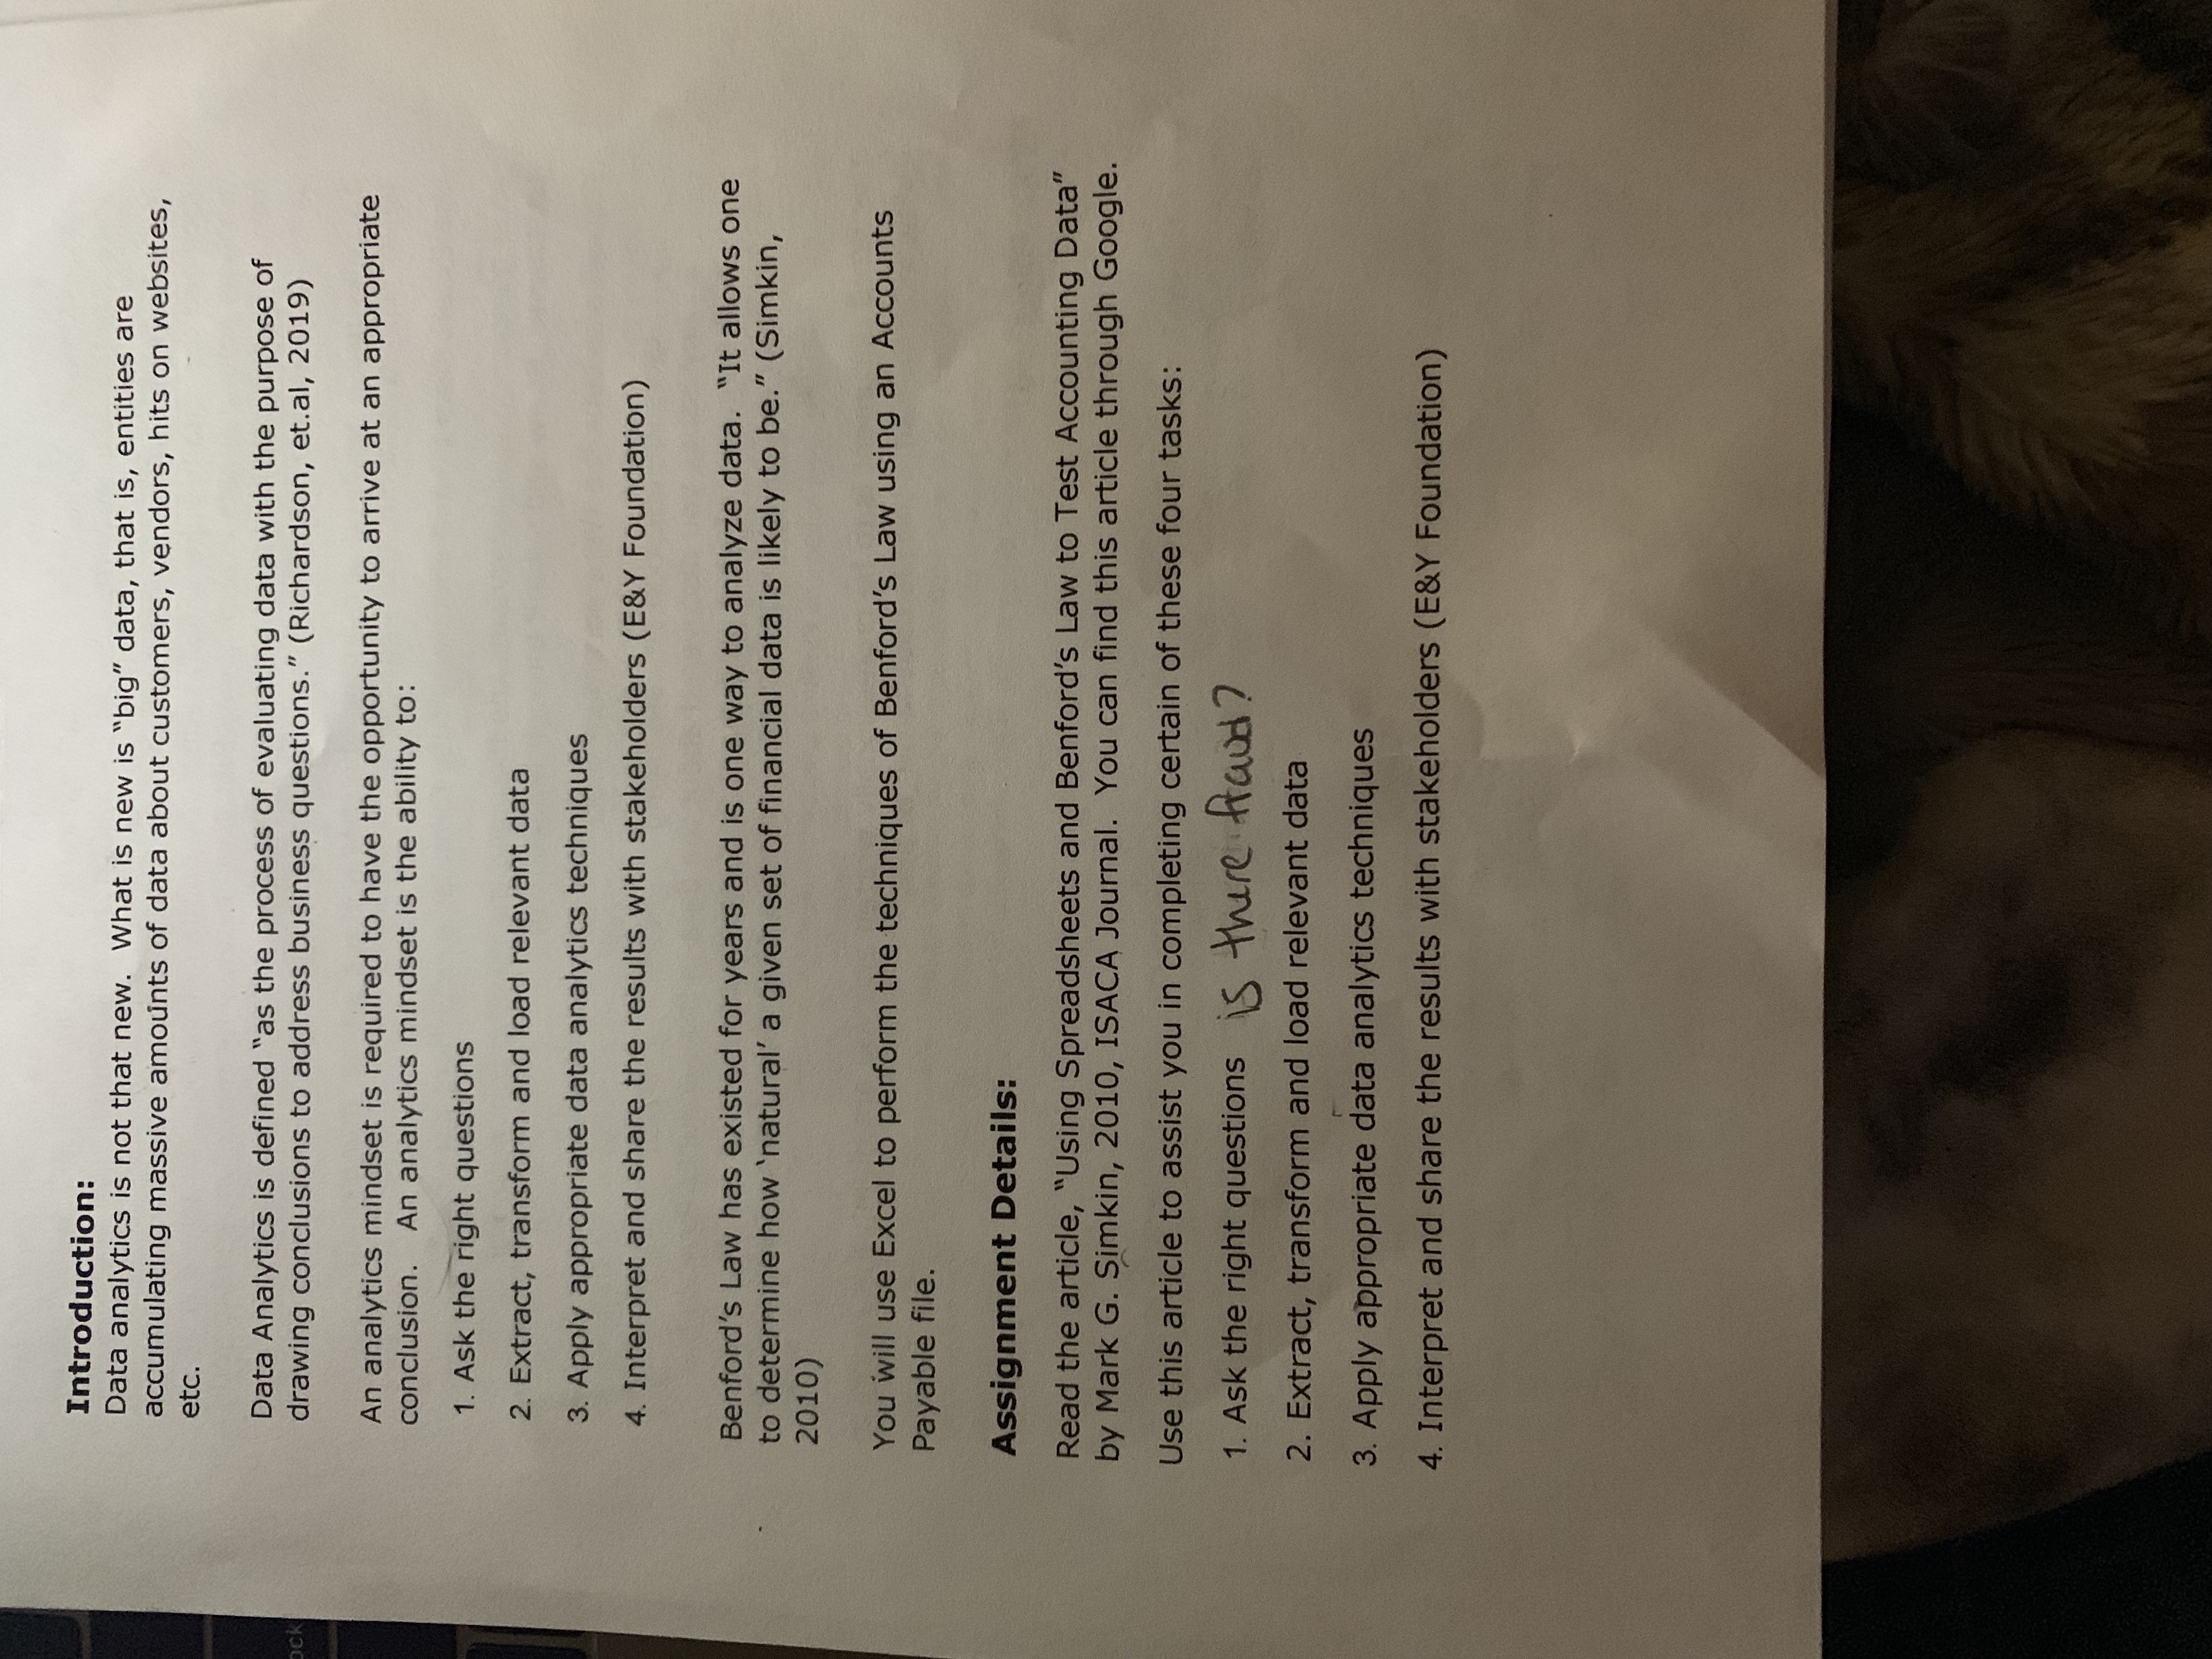
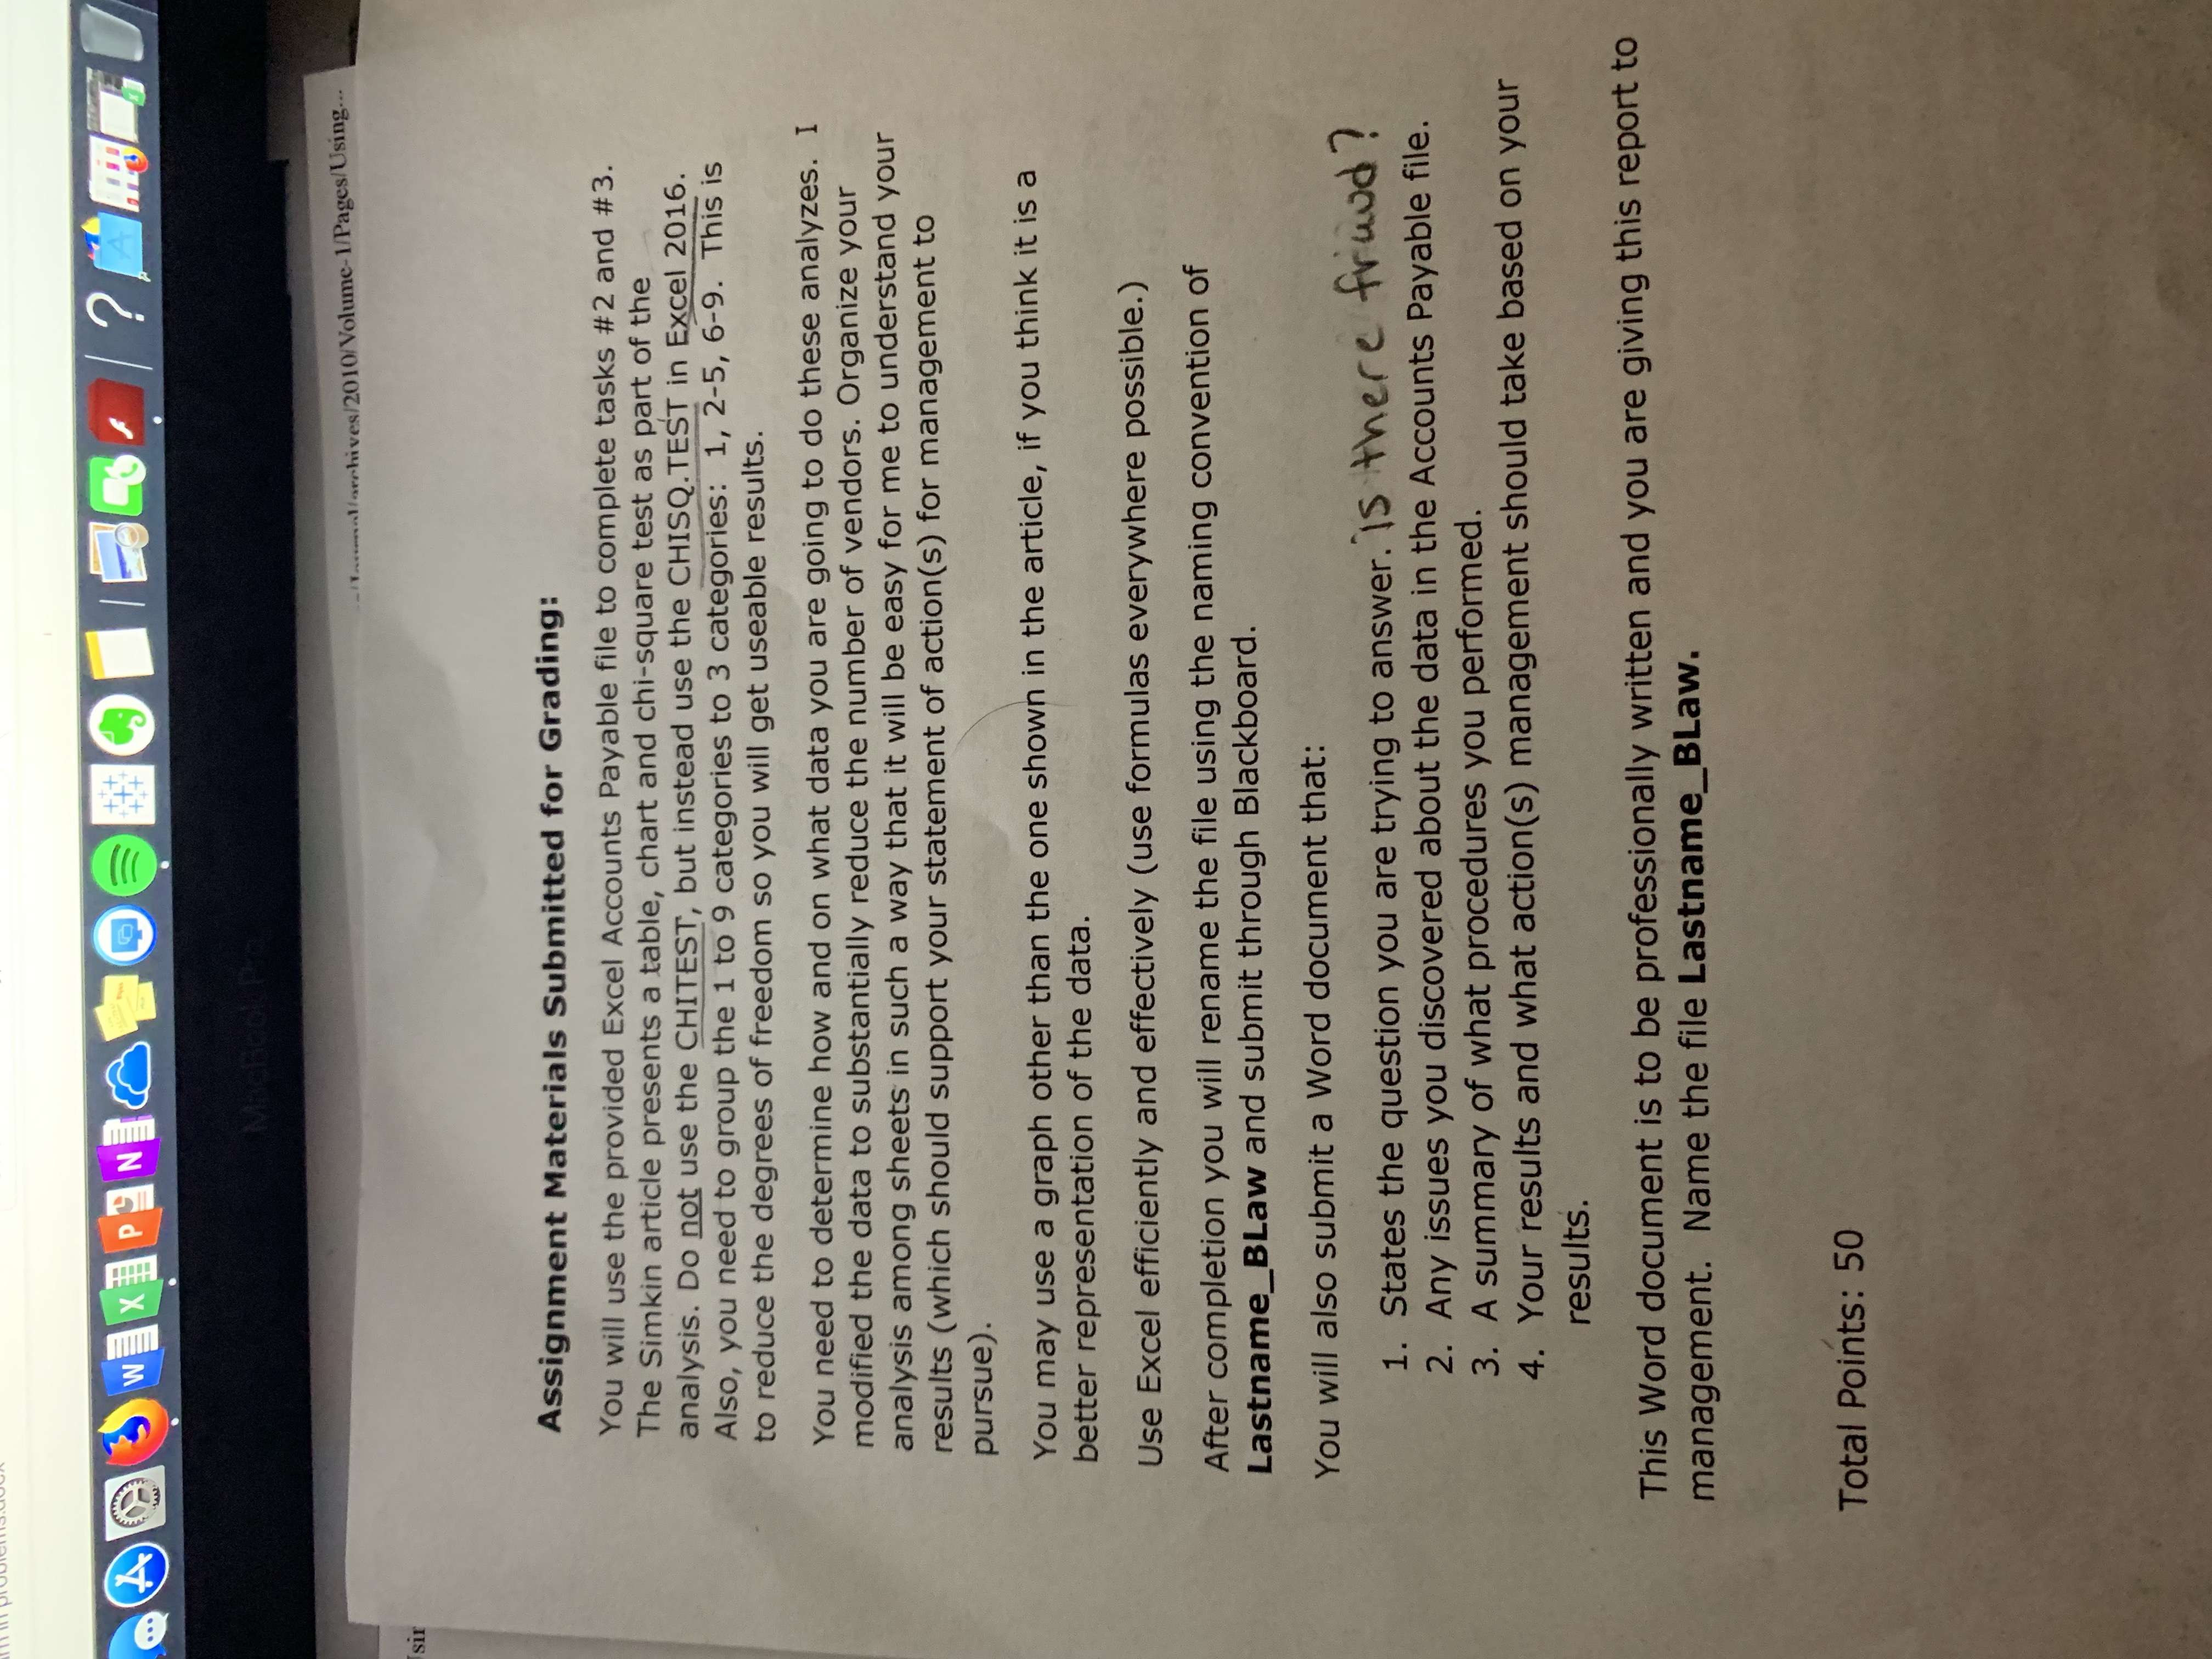
Introduction : Data analytics is not that new . What is new is " big " data , that is , entities are* etc accumulating massive amounts of data about customers , vendors , hits on websites , Data Analytics is defined " as the process of evaluating data with the purpose of drawing conclusions to address business questions . " ( Richardson , et . al , 2019 ) An analytics mindset is required to have the opportunity to arrive at an appropriate conclusion . An analytics mindset is the ability to :" 1 . Ask the right questions 2 . Extract , transform and load relevant data 3 . Apply appropriate data analytics techniques 4 . Interpret and share the results with stakeholders ( E&Y Foundation ) Benford's Law has existed for years and is one way to analyze data . " It allows one to determine how ' natural ' a given set of financial data is likely to be . " ( Simkin , 2010 ) Payable file . You will use Excel to perform the techniques of Benford's Law using an Accounts Assignment Details : Read the article , " Using Spreadsheets and Benford's Law to Test Accounting Data " by Mark G . Simkin , 2010 , ISACA Journal . You can find this article through Google Use this article to assist you in completing certain of these four tasks :" 1 . Ask the right questions is there . fraud ? 2 . Extract , transform and load relevant data 3 . Apply appropriate data analytics techniques 4 . Interpret and share the results with stakeholders ( E&Y Foundation )... WXIPIN ?RI MasKool: P w.mal/archives/2010/Volume-1/Pages/Using... sir Assignment Materials Submitted for Grading: You will use the provided Excel Accounts Payable file to complete tasks #2 and # 3. The Simkin article presents a table, chart and chi-square test as part of the analysis. Do not use the CHITEST, but instead use the CHISQ.TEST in Excel 2016. Also, you need to group the 1 to 9 categories to 3 categories: 1, 2-5, 6-9. This is to reduce the degrees of freedom so you will get useable results. You need to determine how and on what data you are going to do these analyzes. I modified the data to substantially reduce the number of vendors. Organize your analysis among sheets in such a way that it will be easy for me to understand your results (which should support your statement of action(s) for management to pursue) You may use a graph other than the one shown in the article, if you think it is a better representation of the data. Use Excel efficiently and effectively (use formulas everywhere possible.) After completion you will rename the file using the naming convention of Lastname_BLaw and submit through Blackboard. You will also submit a Word document that: 1. States the question you are trying to answer. IS there fraud ? 2. Any issues you discovered about the data in the Accounts Payable file. 3. A summary of what procedures you performed. 4. Your results and what action(s) management should take based on your results. This Word document is to be professionally written and you are giving this report to management. Name the file Lastname_BLaw. Total Points: 50