

Question: Introduction Industries differ on both internal and external dimensions. Internal issues such as culture and operating models are often specific to industries, while the external
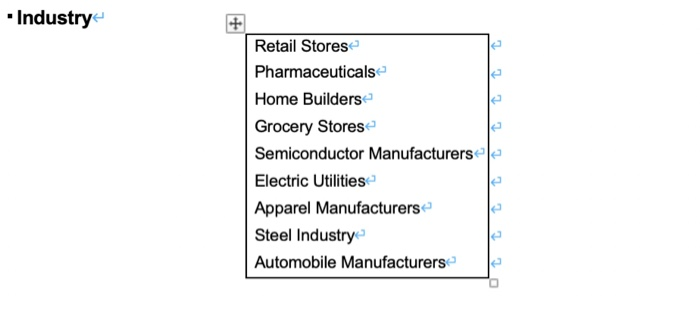
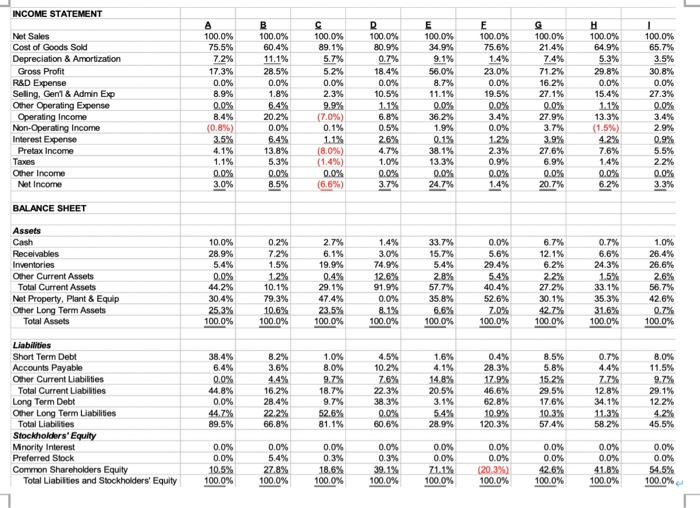
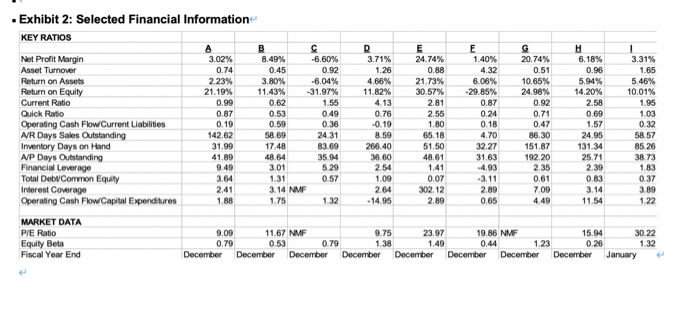
Industry Retail Stores Pharmaceuticals Home Builders Grocery Stores Semiconductor Manufacturers Electric Utilities Apparel Manufacturers Steel Industry Automobile Manufacturers INCOME STATEMENT Net Sales Cost of Goods Sold Depreciation & Amortization Gross Profit R&D Expense Seling. Gent & Admin Exp Other Operating Expense Operating Income Non-Operating Income Interest Expense Pretax Income Taxes Other Income Net Income A 100.0% 75.5% 7.2% 17.3% 0.0% 8.9% 0.0% 8.4% (0.8%) 3.5% 4.1% 1.1% 0.0% 3.0% B 100.0% 60.4% 11.1% 28.5% 0.0% 1.8% 6.4% 20.2% 0.0% 6.4% 13.8% 5.3% 0.0% 8.5% 100.0% 89.1% 5.7% 5.2% 0.0% 2.3% 9.9% (7.0%) 0.1% 1.1% (8.0%) (1.4%) 0.0% (6.6%) R 100.0% 80.9% 0.7% 18.4% 0.0% 10.5% 1.1% 6.8% 0.5% 2.6% 4.7% 1.0% 0.0% 3.7% E 100.0% 34.9% 9.1% 56.0% 8.7% 11.1% 0.0% 36.2% 1.9% 0.1% 38.1% 13.3% 0.0% 24.7% E 100.0% 75.6% 1.4% 23.0% 0.0% 19.5% 0.0% 3.4% 0.0% 1.2% 2.3% 0.9% 0.0% 1.4% 100.0% 21.4% 7.4% 71.2% 16.2% 27.1% 0.0% 27.9% 3.7% 3.9% 27.6% 6.9% 0.0% 20.7% 100.0% 64.9% 5.3% 29.8% 0.0% 15.4% 1.1% 13.3% (1.5%) 4.2% 7.6% 1.4% 0.0% 62% 100.0% 65.7% 3.5% 30.8% 0.0% 27.3% 0.0% 3.4% 2.9% 0.9% 5.5% 2.2% 0.0% 3.3% BALANCE SHEET Assets Cash Receivables Inventories Other Current Assets Total Current Assets Net Property, Plant & Equip Other Long Term Assets Total Assets 10.0% 28.9% 5.4% 0.0% 44.2% 30.4% 25.3% 100.0% 0.2% 7.2% 1.5% 1.2% 10.1% 79.3% 10.6% 100.0% 2.7% 6.1% 19.9% 0.4% 29.1% 47.4% 23.5% 100.0% 1.4% 3.0% 74.9% 12.6% 91.9% 33.7% 15.7% 5.4% 2.8% 57.7% 35.8% 6.6% 100.0% 0.0% 5.6% 29.4% 5.4% 40.4% 52.6% 7.0% 100.0% 6.7% 12.1% 6.2% 2.2% 27.2% 30.1% 42.7% 100.0% 0.7% 6.6% 24.3% 1.5% 33.1% 35.3% 31.6% 100.0% 1.0% 26.4% 26.6% 2.6% 56.7% 42.6% 0.7% 100.0% 0.0% 8.1% 100.0% 8.2% 3.6% Liabilities Short Term Debt Accounts Payable Other Current Liabilities Total Current Liabilities Long Term Debt Other Long Term Liabilities Total Liabilities Stockholds' Equity Minority Interest Preferred Stock Common Shareholders Equity Total Liabilities and Stockholders' Equity 38.4% 6.4% 0.0% 44.8% 0.0% 44.7% 89.5% 16.2% 28.4% 22.2% 66.8% 1.0% 8.0% 9.7% 18.7% 9.7% 52.6% 81.1% 4.5% 10.2% 7.6% 22.3% 38.3% 0.0% 60.6% 1.6% 4.1% 14.8% 20.5% 3.1% 5.4% 28.9% 0.4% 28.3% 17.9% 46.6% 62.8% 10.9% 120.3% 8.5% 5.8% 15.2% 29.5% 17.6% 10.3% 57.4% 0.7% 4.4% 7.7% 12.8% 34.1% 11.3% 58.2% 8.0% 11.5% 9.7% 29.1% 12.2% 4.2% 45.5% 0.0% 0.0% 10.5% 100.0% 0.0% 5.4% 27.8% 100.0% 0.0% 0.3% 18.6% 100.0% 0.0% 0.3% 39.1% 100.0% 0.0% 0.0% 71.1% 100.0% 0.0% 0.0% (20.3%) 100.0% 0.0% 0.0% 42.6% 100.0% 0.0% 0.0% 41.8% 100.0% 0.0% 0.0% 54.5% 100.0% Exhibit 2: Selected Financial Information KEY RATIOS D 11.43% Net Profit Margin Asset Turnover Return on Assets Return on Equity Current Ratio Quick Ratio Operating Cash Flow Current Liabilities NR Days Sales Outstanding Inventory Days on Hand AP Days Outstanding Financial Leverage Total DebComon Equity Interest Coverage Operating Cash Flow Capital Expenditures 3.02% 0.74 2.23% 21.19% 0.99 0.87 0.19 142.62 31.99 41.89 9.49 3.64 2.41 1.88 D 3.71% 1.26 4.66% 11.82% 4.13 0.76 -0.19 8.59 266.40 36.60 2.54 1.09 2.64 .14.95 8.49% -6.60% 0.45 0.92 3.80% -6.04% -31.97% 0.62 1.55 0.53 0.49 0.59 0.36 58.69 24 31 17.48 83.69 48.64 35.94 3.01 5.29 1.31 0.57 3.14 NMF 1.75 1.32 E 24.74% 0.88 21.73% 30.57% 2.81 2.55 1.80 65.18 51.50 48.61 1.41 0.07 302.12 2.89 E 1.40% 4.32 6.06% - 29.85% 0.87 0.24 0.18 4.70 32.27 31.63 -4.93 -3.11 2.89 0.65 3.31% 1.65 5.46% 10.01% 1.95 1.03 0.32 G 20.74% 0.51 10.65% 24.98% 0.92 0.71 0.47 86.30 151.87 192.20 2.35 0.61 7.09 4.49 6.18% 0.96 5.94% 14.20% 2.58 0.69 1.57 24.95 131.34 25.71 2.39 0.83 3.14 11.54 58.57 85.26 38.73 1.83 0.37 3.89 1.22 MARKET DATA P/E Ratio Equity Beta Fiscal Year End 9.09 11.67 NMF 9.75 23.97 19.86 NMF 15.94 30 22 0.79 0.53 0.79 1.38 1.49 0.44 1.23 0.26 1.32 December December December December December December December December January Industry Retail Stores Pharmaceuticals Home Builders Grocery Stores Semiconductor Manufacturers Electric Utilities Apparel Manufacturers Steel Industry Automobile Manufacturers INCOME STATEMENT Net Sales Cost of Goods Sold Depreciation & Amortization Gross Profit R&D Expense Seling. Gent & Admin Exp Other Operating Expense Operating Income Non-Operating Income Interest Expense Pretax Income Taxes Other Income Net Income A 100.0% 75.5% 7.2% 17.3% 0.0% 8.9% 0.0% 8.4% (0.8%) 3.5% 4.1% 1.1% 0.0% 3.0% B 100.0% 60.4% 11.1% 28.5% 0.0% 1.8% 6.4% 20.2% 0.0% 6.4% 13.8% 5.3% 0.0% 8.5% 100.0% 89.1% 5.7% 5.2% 0.0% 2.3% 9.9% (7.0%) 0.1% 1.1% (8.0%) (1.4%) 0.0% (6.6%) R 100.0% 80.9% 0.7% 18.4% 0.0% 10.5% 1.1% 6.8% 0.5% 2.6% 4.7% 1.0% 0.0% 3.7% E 100.0% 34.9% 9.1% 56.0% 8.7% 11.1% 0.0% 36.2% 1.9% 0.1% 38.1% 13.3% 0.0% 24.7% E 100.0% 75.6% 1.4% 23.0% 0.0% 19.5% 0.0% 3.4% 0.0% 1.2% 2.3% 0.9% 0.0% 1.4% 100.0% 21.4% 7.4% 71.2% 16.2% 27.1% 0.0% 27.9% 3.7% 3.9% 27.6% 6.9% 0.0% 20.7% 100.0% 64.9% 5.3% 29.8% 0.0% 15.4% 1.1% 13.3% (1.5%) 4.2% 7.6% 1.4% 0.0% 62% 100.0% 65.7% 3.5% 30.8% 0.0% 27.3% 0.0% 3.4% 2.9% 0.9% 5.5% 2.2% 0.0% 3.3% BALANCE SHEET Assets Cash Receivables Inventories Other Current Assets Total Current Assets Net Property, Plant & Equip Other Long Term Assets Total Assets 10.0% 28.9% 5.4% 0.0% 44.2% 30.4% 25.3% 100.0% 0.2% 7.2% 1.5% 1.2% 10.1% 79.3% 10.6% 100.0% 2.7% 6.1% 19.9% 0.4% 29.1% 47.4% 23.5% 100.0% 1.4% 3.0% 74.9% 12.6% 91.9% 33.7% 15.7% 5.4% 2.8% 57.7% 35.8% 6.6% 100.0% 0.0% 5.6% 29.4% 5.4% 40.4% 52.6% 7.0% 100.0% 6.7% 12.1% 6.2% 2.2% 27.2% 30.1% 42.7% 100.0% 0.7% 6.6% 24.3% 1.5% 33.1% 35.3% 31.6% 100.0% 1.0% 26.4% 26.6% 2.6% 56.7% 42.6% 0.7% 100.0% 0.0% 8.1% 100.0% 8.2% 3.6% Liabilities Short Term Debt Accounts Payable Other Current Liabilities Total Current Liabilities Long Term Debt Other Long Term Liabilities Total Liabilities Stockholds' Equity Minority Interest Preferred Stock Common Shareholders Equity Total Liabilities and Stockholders' Equity 38.4% 6.4% 0.0% 44.8% 0.0% 44.7% 89.5% 16.2% 28.4% 22.2% 66.8% 1.0% 8.0% 9.7% 18.7% 9.7% 52.6% 81.1% 4.5% 10.2% 7.6% 22.3% 38.3% 0.0% 60.6% 1.6% 4.1% 14.8% 20.5% 3.1% 5.4% 28.9% 0.4% 28.3% 17.9% 46.6% 62.8% 10.9% 120.3% 8.5% 5.8% 15.2% 29.5% 17.6% 10.3% 57.4% 0.7% 4.4% 7.7% 12.8% 34.1% 11.3% 58.2% 8.0% 11.5% 9.7% 29.1% 12.2% 4.2% 45.5% 0.0% 0.0% 10.5% 100.0% 0.0% 5.4% 27.8% 100.0% 0.0% 0.3% 18.6% 100.0% 0.0% 0.3% 39.1% 100.0% 0.0% 0.0% 71.1% 100.0% 0.0% 0.0% (20.3%) 100.0% 0.0% 0.0% 42.6% 100.0% 0.0% 0.0% 41.8% 100.0% 0.0% 0.0% 54.5% 100.0% Exhibit 2: Selected Financial Information KEY RATIOS D 11.43% Net Profit Margin Asset Turnover Return on Assets Return on Equity Current Ratio Quick Ratio Operating Cash Flow Current Liabilities NR Days Sales Outstanding Inventory Days on Hand AP Days Outstanding Financial Leverage Total DebComon Equity Interest Coverage Operating Cash Flow Capital Expenditures 3.02% 0.74 2.23% 21.19% 0.99 0.87 0.19 142.62 31.99 41.89 9.49 3.64 2.41 1.88 D 3.71% 1.26 4.66% 11.82% 4.13 0.76 -0.19 8.59 266.40 36.60 2.54 1.09 2.64 .14.95 8.49% -6.60% 0.45 0.92 3.80% -6.04% -31.97% 0.62 1.55 0.53 0.49 0.59 0.36 58.69 24 31 17.48 83.69 48.64 35.94 3.01 5.29 1.31 0.57 3.14 NMF 1.75 1.32 E 24.74% 0.88 21.73% 30.57% 2.81 2.55 1.80 65.18 51.50 48.61 1.41 0.07 302.12 2.89 E 1.40% 4.32 6.06% - 29.85% 0.87 0.24 0.18 4.70 32.27 31.63 -4.93 -3.11 2.89 0.65 3.31% 1.65 5.46% 10.01% 1.95 1.03 0.32 G 20.74% 0.51 10.65% 24.98% 0.92 0.71 0.47 86.30 151.87 192.20 2.35 0.61 7.09 4.49 6.18% 0.96 5.94% 14.20% 2.58 0.69 1.57 24.95 131.34 25.71 2.39 0.83 3.14 11.54 58.57 85.26 38.73 1.83 0.37 3.89 1.22 MARKET DATA P/E Ratio Equity Beta Fiscal Year End 9.09 11.67 NMF 9.75 23.97 19.86 NMF 15.94 30 22 0.79 0.53 0.79 1.38 1.49 0.44 1.23 0.26 1.32 December December December December December December December December January
Step by Step Solution
There are 3 Steps involved in it

Get step-by-step solutions from verified subject matter experts