

Question: introduction: one-sample t-tests calculate how likely a sample mean estimates a population mean. Two-sample t-tests compare two independent groups or treatments and determine if the
introduction: one-sample t-tests calculate how likely a sample mean estimates a population mean. Two-sample t-tests compare two independent groups or treatments and determine if the difference between the treatments or groups is statistically significant.
Question:
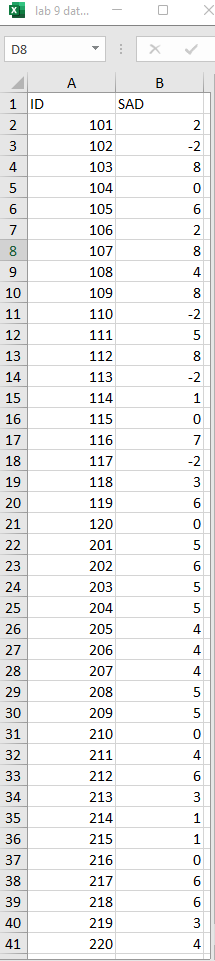
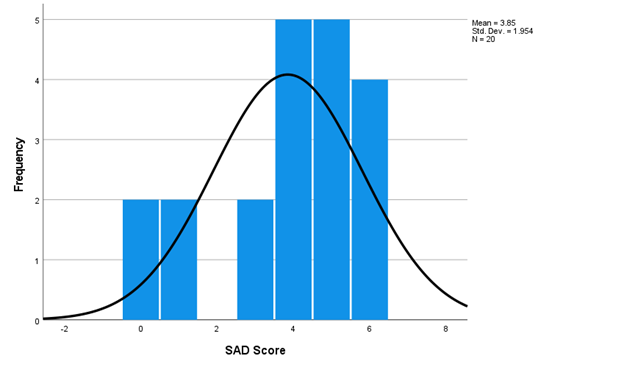
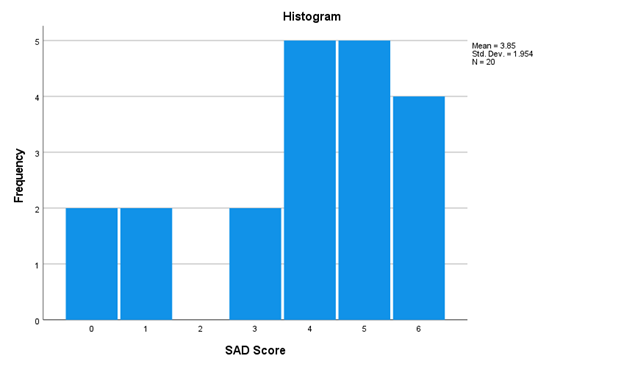
Participants were recruited from psychological science courses at several public universities. participants were eligible to participate if they are prone to SAD symptoms as measured by the SAD questionnaire. participants were provided with a broad-spectrum light designed to simulate sunlight, and thus reduce SAD symptoms, and to use the light in their room for 4 or 6 hours per day. a SAD questionnaire was administered at the beginning of the study and again 8 weeks later. the "SAD score" is a difference score calculated by subtracting the post-study SAD score from the pre-study SAD score. prior studies with light therapy have shown a reduction in SAD score after eight weeks of light therapy for 6 hours/day. the researchers of the present study wonder if only 4 hours of light therapy per day is as effective as 6 hours in reducing SAD symptoms.
1.) State the null and alternative hypotheses for this study and be done in words using statistical symbols.
2.) Write the statistical statements for each t-test and use 90% CIs. What can you say about the sample means in regard to the population means from these tests?
3.) Conduct a two-sample t-test to test your hypotheses
4.) write a statistical statement for your results and interpret your results in terms of rejecting/failing to reject the null.
Use the data below to support your answer, use whats needed:
Participants grouped by: Length of light therapy
- 4 hours/day (ID numbers in the 100s)
- 6 hours/day (ID numbers in the 200s)
X lab 9 dat... 0 X D8 X V A B 1 ID SAD 2 101 3 102 -2 4 103 8 104 O 6 105 6 106 8 107 9 108 4 10 109 8 11 110 -2 12 111 13 112 14 113 -2 15 114 16 115 17 116 18 117 -2 19 118 20 119 6 21 120 O 22 201 5 23 202 6 24 203 5 25 204 5 26 205 4 27 206 4 28 207 4 29 208 30 209 31 210 0 32 211 4 33 212 6 34 213 3 35 214 36 215 37 216 38 217 6 39 218 6 40 219 41 220 4Mean - 3.85 51d. Dev. = 1.954 IN - 20 3 Frequency 2 -2 2 6 B SAD Score
Step by Step Solution
There are 3 Steps involved in it

Get step-by-step solutions from verified subject matter experts