

Question: Introduction: This case is written with a primary focus on operations strategy and /or quantitative methods. The question of this case is straightforward -

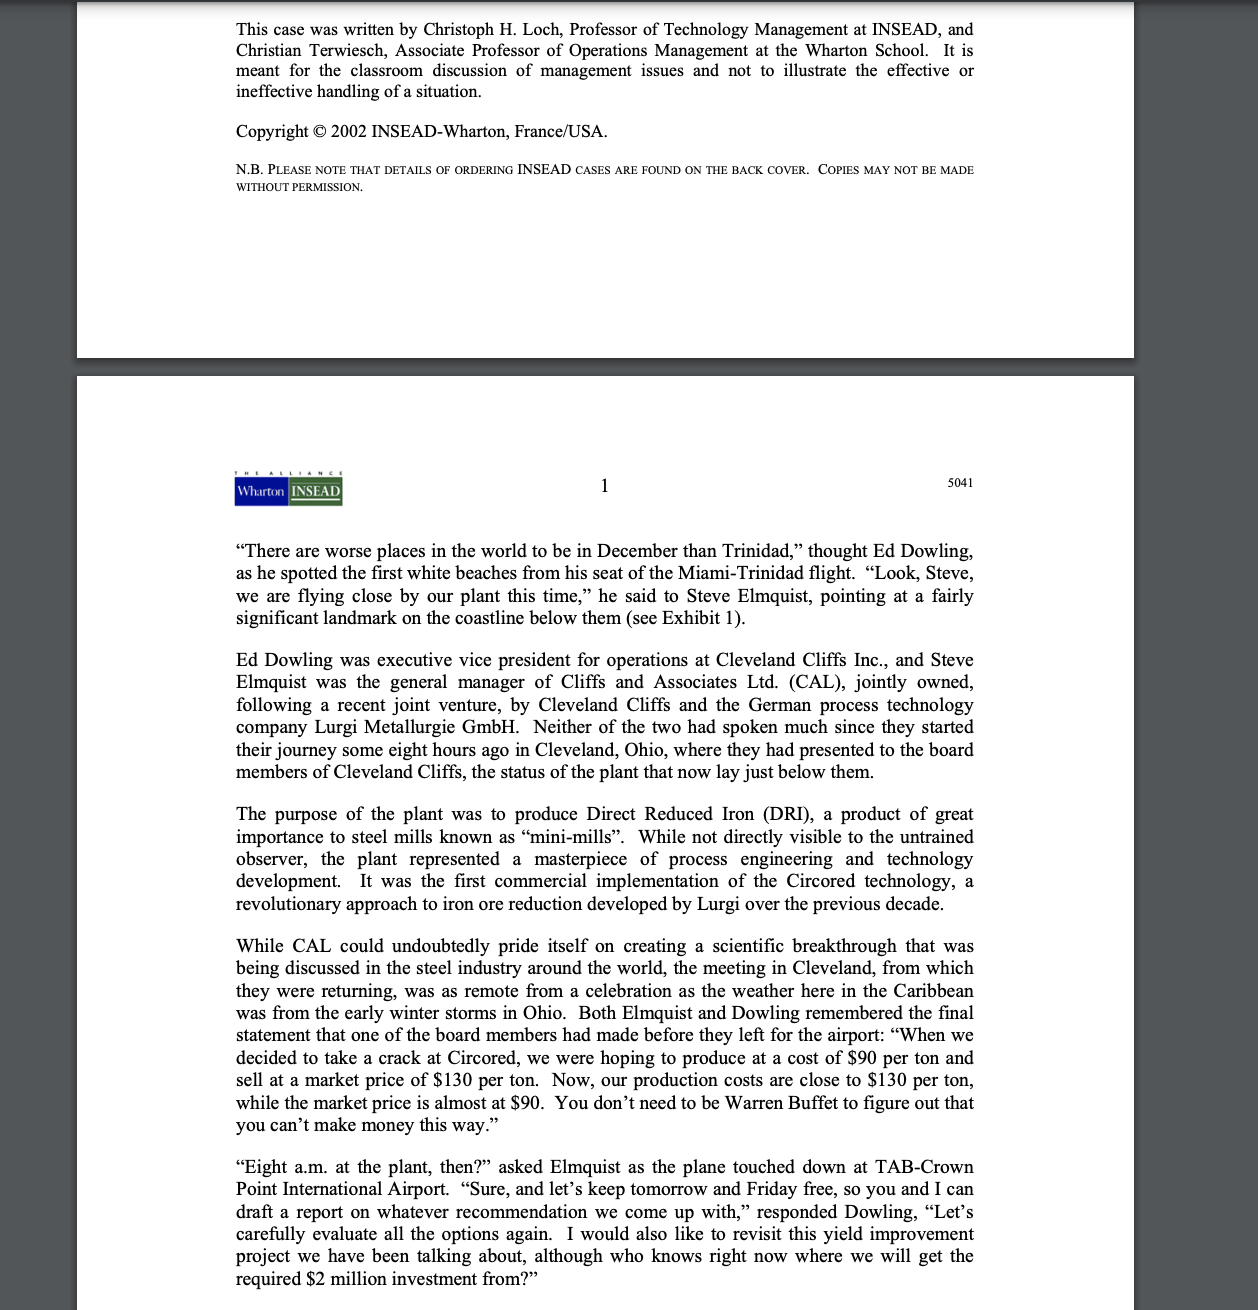
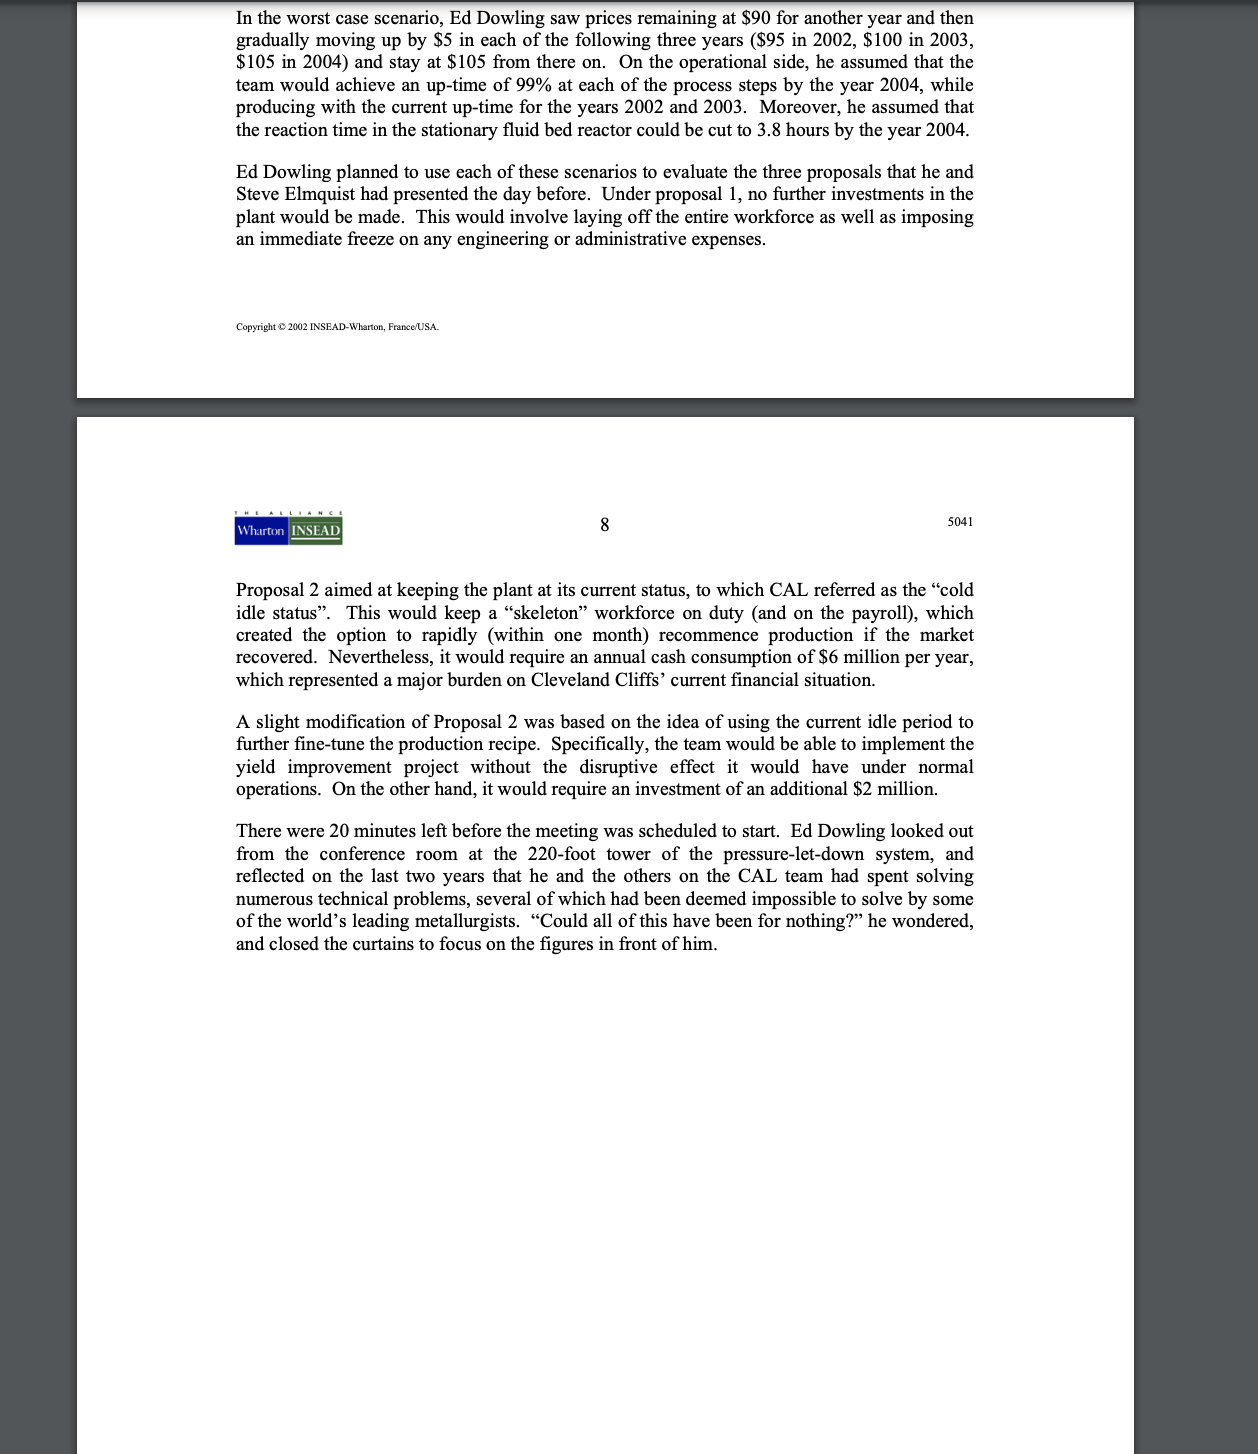
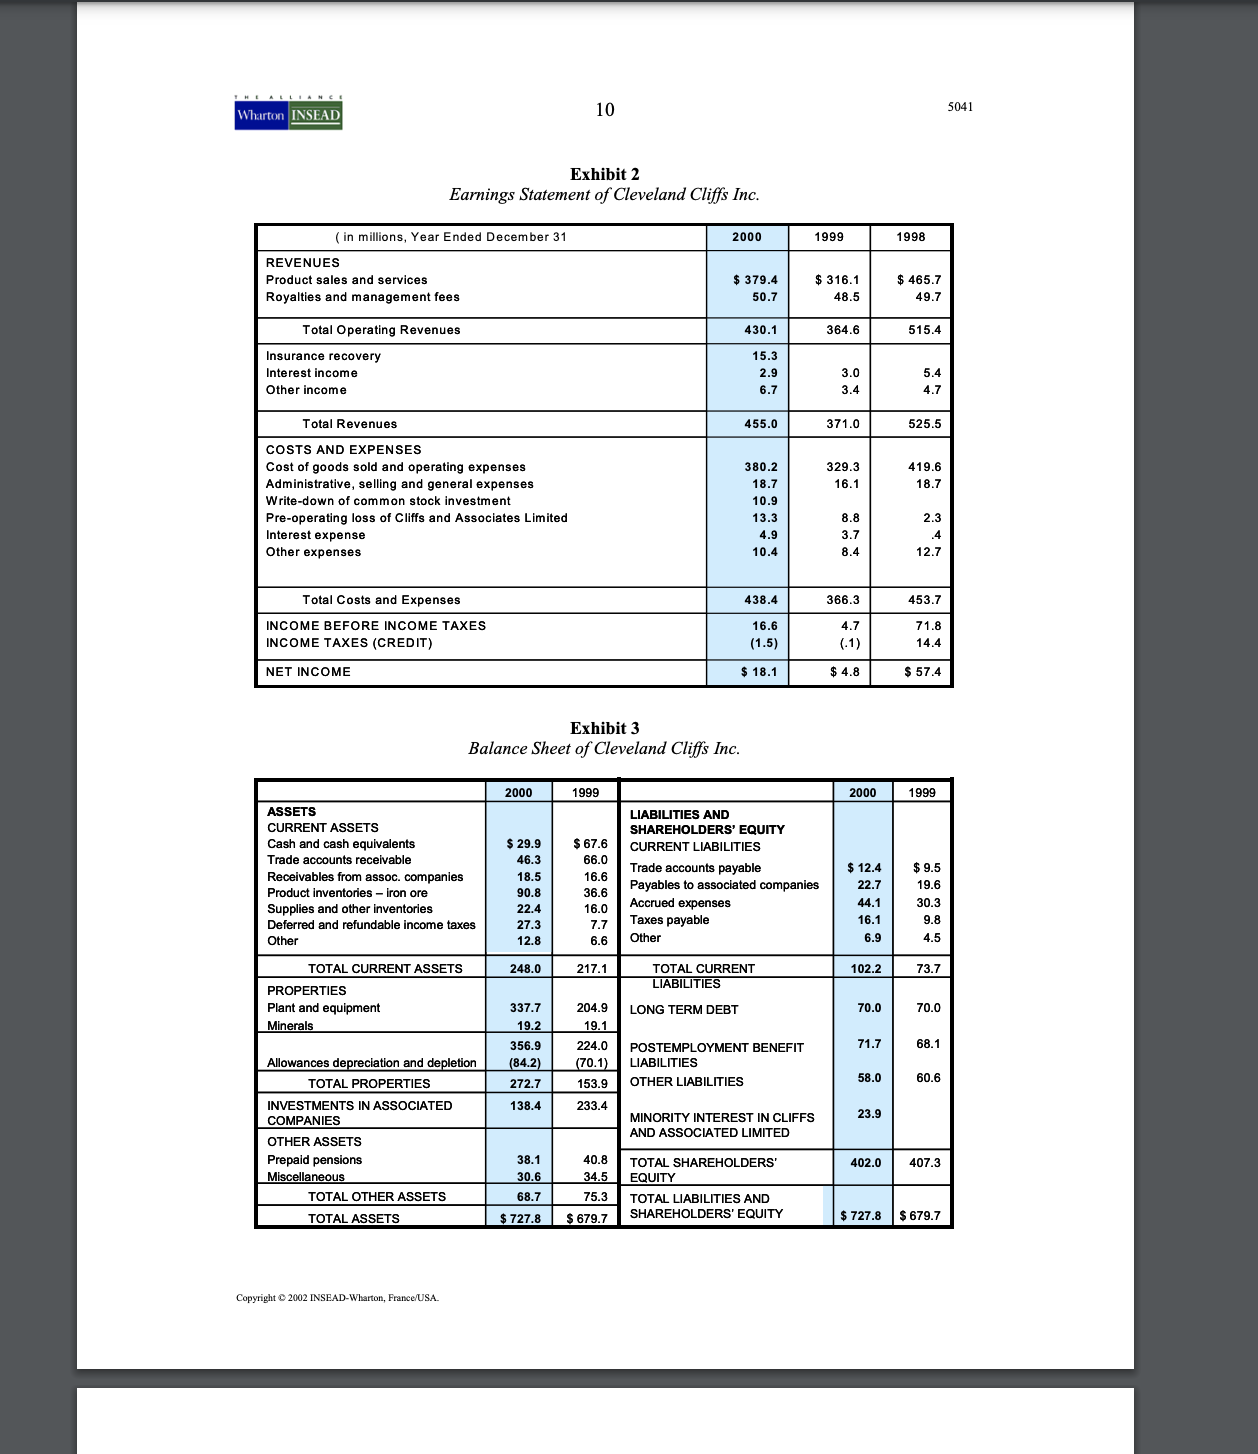
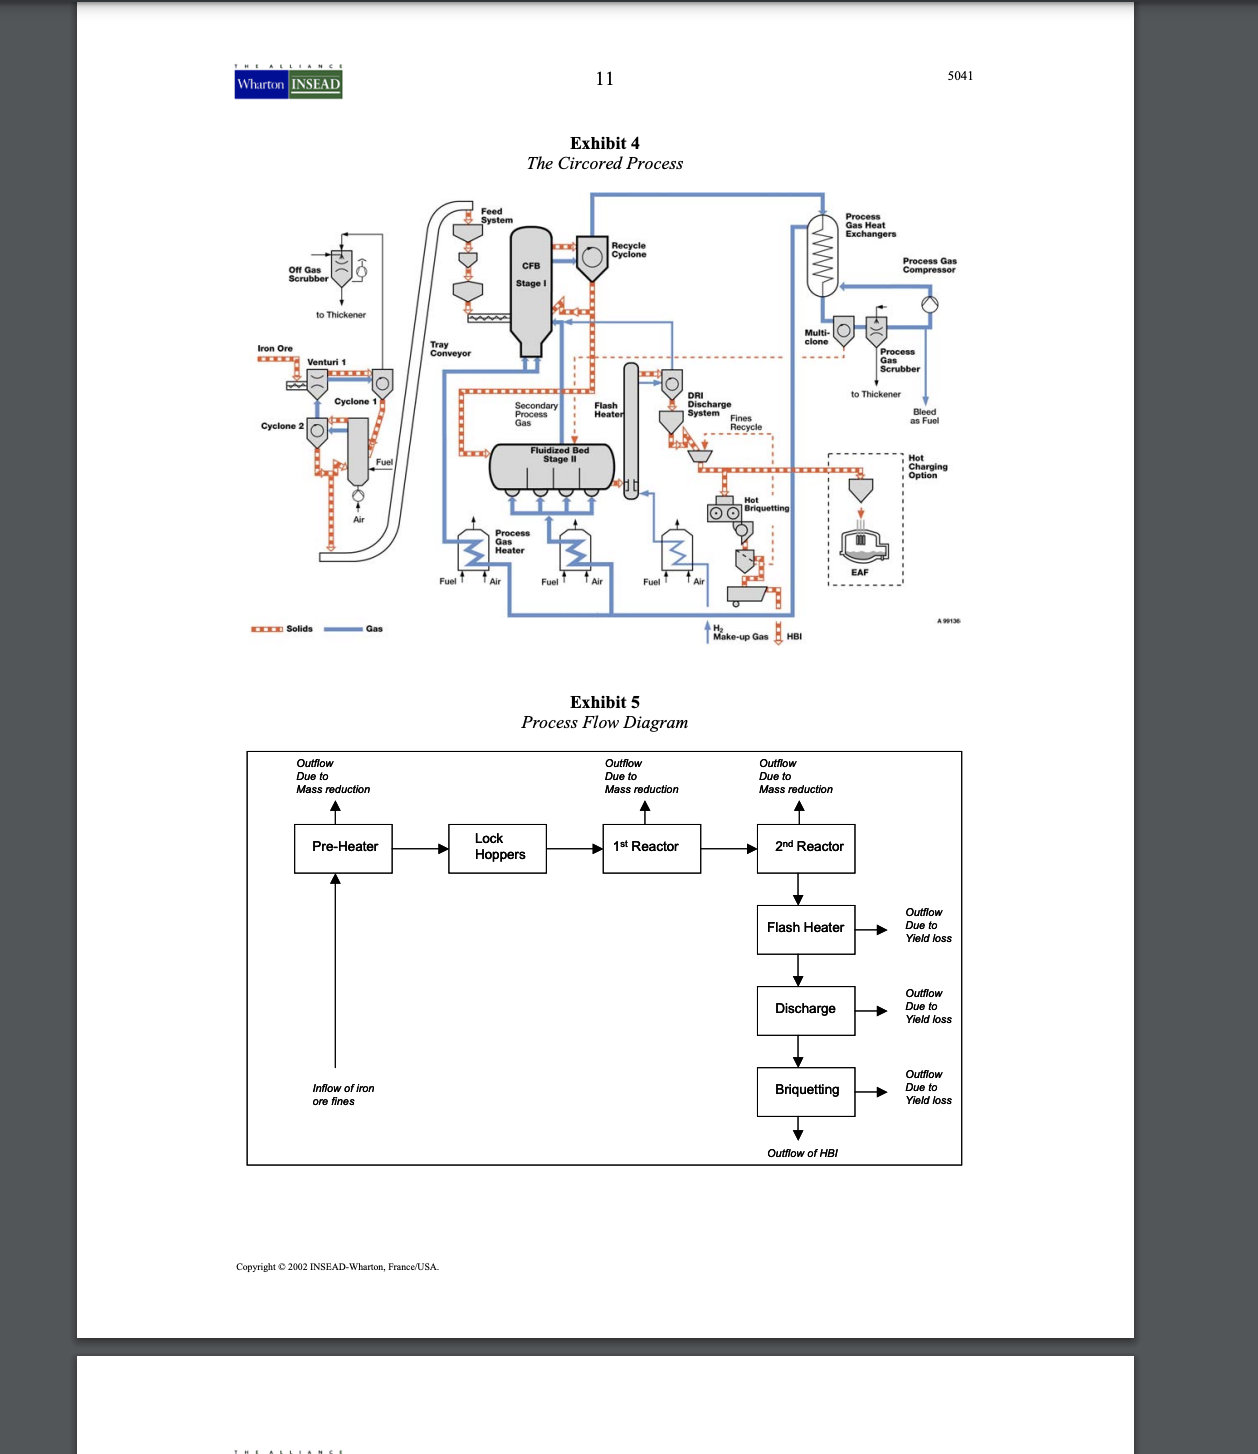
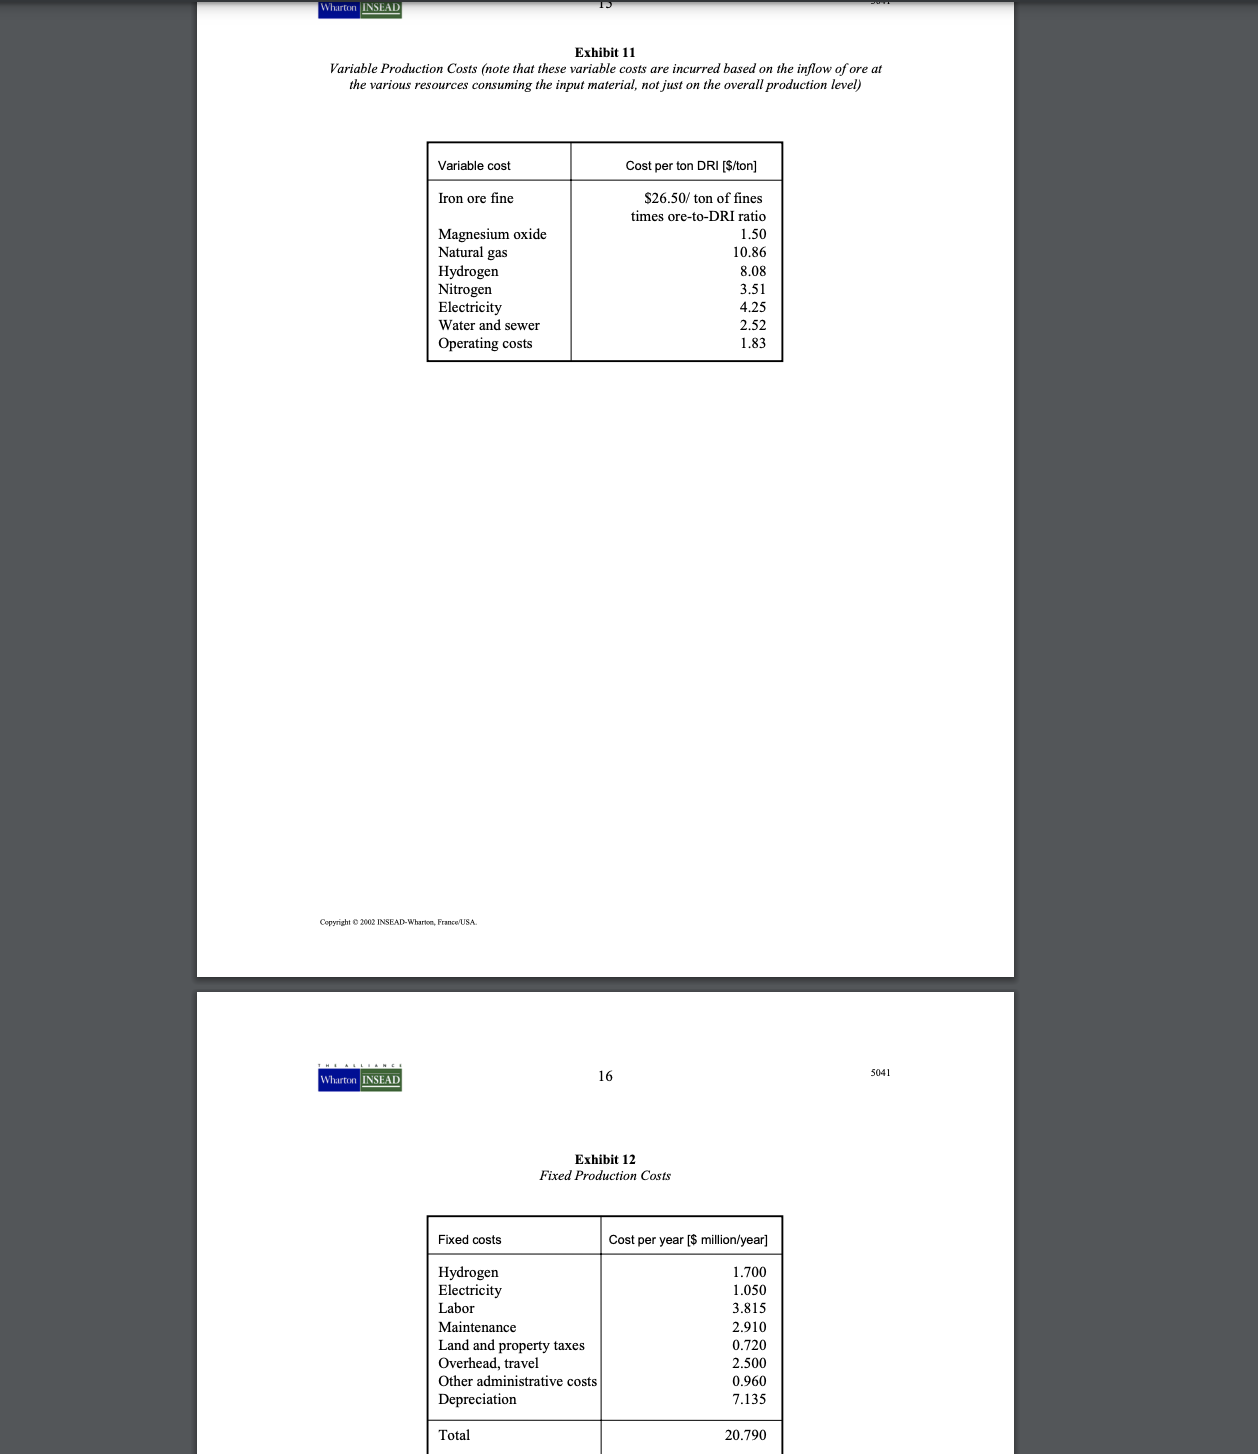
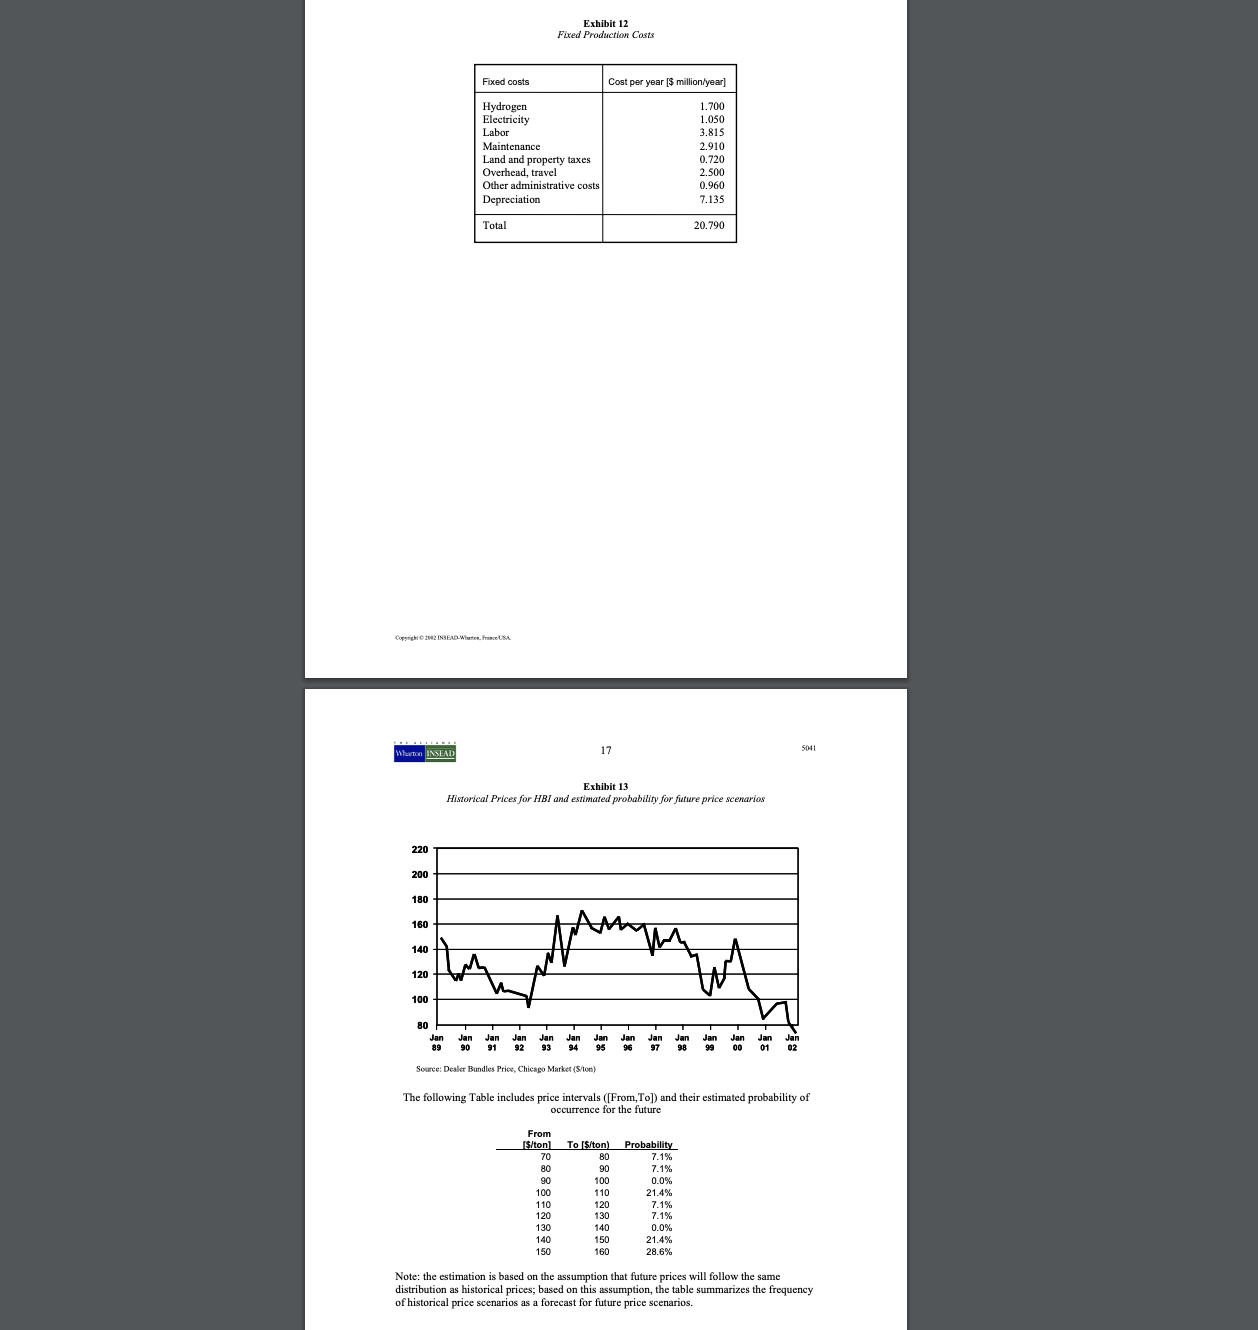
Introduction: This case is written with a primary focus on operations strategy and /or quantitative methods. The question of this case is straightforward - Shall we close down and write the plant off? To begin the analysis, we need to understand the process flows. Chapter 3 in the textbook provides a relatively detailed structure of the process flows. Following the process flow analysis, the operation's cost structure is required to be conducted in order to make a recommendation. The alternatives could be: Discontinue the operation immediately. Move the plant to idle status. If the plant is not to be closed, consider additional investments to fine-tune the process technology. Based on the information above, please use both questions to discuss: 1. As a member of, or a consultant to, the board of Cleveland Cliffs, what would you recommend concerning the future of the plant? Discuss the alternatives, then reflect what this means for Cleveland Cliffs' long-term valuation. 2. At the time of the case, the market price of DRI is $75 per ton (at the plant). What is your assessment of the plant's current production cost, measured in the cost-per-ton of output? What is your assessment of the two improvement projects suggested by the plant? Would you invest in them? When evaluating the yield improvement project, assume that the project reduces yield losses to 0% at the flash heater and/or 0% at the briquetting machine. Use the spreadsheet template attached to the case in Module 2 for this question. Introduction: This case is written with a primary focus on operations strategy and /or quantitative methods. The question of this case is straightforward - Shall we close down and write the plant off? To begin the analysis, we need to understand the process flows. Chapter 3 in the textbook provides a relatively detailed structure of the process flows. Following the process flow analysis, the operation's cost structure is required to be conducted in order to make a recommendation. The alternatives could be: Discontinue the operation immediately. Move the plant to idle status. If the plant is not to be closed, consider additional investments to fine-tune the process technology. Based on the information above, please use both questions to discuss: 1. As a member of, or a consultant to, the board of Cleveland Cliffs, what would you recommend concerning the future of the plant? Discuss the alternatives, then reflect what this means for Cleveland Cliffs' long-term valuation. 2. At the time of the case, the market price of DRI is $75 per ton (at the plant). What is your assessment of the plant's current production cost, measured in the cost-per-ton of output? What is your assessment of the two improvement projects suggested by the plant? Would you invest in them? When evaluating the yield improvement project, assume that the project reduces yield losses to 0% at the flash heater and/or 0% at the briquetting machine. Use the spreadsheet template attached to the case in Module 2 for this question. This case was written by Christoph H. Loch, Professor of Technology Management at INSEAD, and Christian Terwiesch, Associate Professor of Operations Management at the Wharton School. It is meant for the classroom discussion of management issues and not to illustrate the effective or ineffective handling of a situation. Copyright 2002 INSEAD-Wharton, France/USA. N.B. PLEASE NOTE THAT DETAILS OF ORDERING INSEAD CASES ARE FOUND ON THE BACK COVER. COPIES MAY NOT BE MADE WITHOUT PERMISSION. Wharton INSEAD 5041 "There are worse places in the world to be in December than Trinidad," thought Ed Dowling, as he spotted the first white beaches from his seat of the Miami-Trinidad flight. "Look, Steve, we are flying close by our plant this time," he said to Steve Elmquist, pointing at a fairly significant landmark on the coastline below them (see Exhibit 1). Ed Dowling was executive vice president for operations at Cleveland Cliffs Inc., and Steve Elmquist was the general manager of Cliffs and Associates Ltd. (CAL), jointly owned, following a recent joint venture, by Cleveland Cliffs and the German process technology company Lurgi Metallurgie GmbH. Neither of the two had spoken much since they started their journey some eight hours ago in Cleveland, Ohio, where they had presented to the board members of Cleveland Cliffs, the status of the plant that now lay just below them. The purpose of the plant was to produce Direct Reduced Iron (DRI), a product of great importance to steel mills known as "mini-mills". While not directly visible to the untrained observer, the plant represented a masterpiece of process engineering and technology development. It was the first commercial implementation of the Circored technology, a revolutionary approach to iron ore reduction developed by Lurgi over the previous decade. While CAL could undoubtedly pride itself on creating a scientific breakthrough that was being discussed in the steel industry around the world, the meeting in Cleveland, from which they were returning, was as remote from a celebration as the weather here in the Caribbean was from the early winter storms in Ohio. Both Elmquist and Dowling remembered the final statement that one of the board members had made before they left for the airport: "When we decided to take a crack at Circored, we were hoping to produce at a cost of $90 per ton and sell at a market price of $130 per ton. Now, our production costs are close to $130 per ton, while the market price is almost at $90. You don't need to be Warren Buffet to figure out that you can't make money this way." "Eight a.m. at the plant, then?" asked Elmquist as the plane touched down at TAB-Crown Point International Airport. "Sure, and let's keep tomorrow and Friday free, so you and I can draft a report on whatever recommendation we come up with," responded Dowling, "Let's carefully evaluate all the options again. I would also like to revisit this yield improvement project we have been talking about, although who knows right now where we will get the required $2 million investment from?" The Need for Direct Reduced Iron Cleveland Cliffs, based in Cleveland, Ohio, had established itself over 150 years as the largest iron ore and iron ore pellet suppliers to blast furnace integrated steel makers in North America (see the annual report in Exhibits 2 and 3). In the late 1980s, Cliffs' management observed a decrease in blast furnace based steel making and the continuing increase in Electric Arc Furnace based steel making (mini-mills). Initially, mini-mills made long products of lower quality. However, at the end of the 1980s, new flat steel processes (with reduced rolling effort) allowed mini-mills to move up into the high-quality steel market segment. In order to achieve this shift, they had to improve the purity of the iron input. Up to this point, the mini-mills had primarily been relying on scrap, Copyright 2002 INSEAD-Wharton, France/USA. Wharton INSEAD 2 5041 which contained contaminants (other metals included in the products from which the scrap is made). By using DRI, mini-mills would be able to substantially increase the purity of their inputs, and would hence move into a position to profitably compete against integrated mills, even for high-quality steel. The initiative on the part of mini-mills to use DRI created a dramatic growth in the DRI market, from 17.7 million tons in 1990 to well over 40 million tons by the year 2000. At the end of 1992, the management of Cleveland Cliffs decided to respond to the emerging market needs by developing its own DRI business. A team, led by Bill Calfee and Dick Schultz, began approaching potential partners, including other ore suppliers as well as actual steel producers. Their biggest need for partnering was linked to the technical expertise required in order to produce DRI in large volumes. During the early 1990s, experts debated several alternative technologies of DRI production, including the Iron Carbide process promoted by its inventor, Frank Stevens, the FINMET technology developed by the Austrian steel company Voest- Alpine, and the Circored technology, created by Lurgi Metallurgie GmbH. After many analyses and several fits and starts, Cleveland Cliffs had ultimately decided to work with the Circored technology. The Circored Technology Lurgi Metallurgie GmbH, a subsidiary of the German Metallgesellschaft (later MG Technologies), was a metallurgical process engineering company with a long history and widely acknowledged expertise of working with Circulating Fluid Bed (CFB) processes. Since the 1950s, the company had fluidized solids by blowing high-pressure gas into them and circulating the resulting fluid-like mass through a reactor and a cyclone. The circulating fluid offered high mixing capabilities and, thus, a fast chemical reaction. The company applied the principle to material processing, waste incineration, ore processing, and energy production. Lurgi's Circored process was simple and elegant, using only hydrogen to reduce the ore, and briquetting the DRI to produce Hot Briquetted Iron (HBI). Cleveland Cliffs and Lurgi jointly financed several rounds of testing, which led to extremely promising outcomes. On March 12, 1996, Calfee and Shultz put forward to Cliffs the proposition to build a 500-thousand tons/year facility using the Circored technology. This represented a scale-up of a factor of 5000 compared to the tests, from a 20-kg/hour lab reactor to a 100-tons/hour plant. The maximum feasible capacity for the Circored process was 2 million tons/year. Thus, the proposed plant was a compromise between a pilot facility (which might have achieved a capacity of 50 thousand tons/year) and a scale-efficient plant. Choosing a Location Initially, Cleveland Cliffs envisioned building a plant in the US, as they felt they did not have sufficient international experience to manage a plant abroad. However, early plans already Copyright 2002 INSEAD-Wharton, France/USA. Wharton INSEAD 3 5041 indicated that it would be too expensive to bring gas and iron ore together into the country. Also, their second choice, Venezuela, was soon eliminated. While blessed with abundant amounts of both ore and natural gas, the country, because of political unrest, was perceived as a risky location for foreign direct investment. By 1994, Cliffs started to explore Trinidad, a country with a good, English-speaking workforce, inexpensive natural gas, and a sound political situation. The First Full-scale Implementation of the Circored Technology The basic chemical reaction underlying the Circored process relies on an addition of hydrogen to the iron ore, which reacts to pure iron and water (Fe2O3 + 3H2 2Fe + 3H2O). A process engineering diagram is shown in Exhibit 4, which is further simplified to a conventional process flow diagram, as shown in Exhibit 5. The process recipe specifies a continuous inflow of iron ore fines, which are shipped from ore mines in South America. The first step in the Circored process is the pre-heater, where the iron ore fines (which have the texture of coarse-grained sand) are dried and heated. The heating is achieved through an inflow of high-pressured air, which is blown into the pre- heater from the bottom. The high-speed airflow "fluidizes" the ore, which means that the mixed air-ore mass (a "sandstorm") circulates through the system as if it were a fluid, while being heated to a temperature of approximately 850 - 900C. From the pre-heater, a large bucket elevator transports the ore to the second process step, the lock hoppers. The lock hoppers consist of three large containers, separated by sets of double isolation valves. Their role is to allow the ore to shift from an oxygen-rich environment to a hydrogen atmosphere. This requires a strict separation of oxygen and hydrogen, as any combination of these gases could cause devastating explosions. This atmosphere transition is achieved by means of a simple three-step procedure. First, the iron ore flows through the first of the three containers into the second. Once 10 tons of ore have accumulated in the middle container, the outside valves (to the first and the third containers) are shut off. In the second step, the oxygen is removed from the system by pumping nitrogen into the hopper. Once all the oxygen has been forced out, hydrogen is pumped into the container (a safe procedure because nitrogen is inert and does not react with hydrogen). Thus, the ore has shifted to the hydrogen atmosphere in which the reduction process occurs. Third, the valve to the third lock hopper container is opened and the ore flows into the third container, entering the process atmosphere. From the lock hoppers, the ore enters the first circulating fluidized bed reactor (CFB) where the actual reduction process begins. The reduction takes place at 650C, a temperature low enough for the iron not to stick together in clumps or to the chamber walls, but high enough to ensure an efficient reaction. In the first stage CFB reactor, the material is again fluidized with high-pressure hot hydrogen circulating through the reactor. In this state, the specified 70% reduction is achieved very quickly because the iron sand has a very large surface area, and is perfectly mixed with the hydrogen gas. The 70% reduction is achieved in a retention time of a mere 15 minutes. Copyright 2002 INSEAD-Wharton, France/USA. Wharton INSEAD 5041 After this first reduction, the material is discharged into the stationary Fluidized Bed (FB) reactor. Here, the ore is again fluidized by hot hydrogen, but remains stationary in a "fluidized bed" rather than circulating. The fluid flows through four chambers, bubbling over the top of and through holes in the walls. After 4 hours, a metallization of 95% is achieved. The reactor is the size of a medium, two-family home and contains 400 tons of the hot iron ore at any given moment. Exhibit 6 provides a detailed drawing including the scale of the various process steps. If depressurized appropriately, the product at this stage would be ready to flow directly into a steel furnace. However, the mini-mills to be served by the Circored process are thousands of miles away. This makes it impossible to use DRI directly, as the product in the form that leaves the FB reactor is unstable, and therefore unsafe for transportation - pure iron in a sand- like form (that has a large surface area exposed to the air's oxygen) re-oxidizes, even at room temperature, and may cause fires on a ship. Therefore, the DRI must be pressed into Hot Briquetted Iron (HBI), high-density iron bars that have such a small surface area exposed to the air that they do not re-oxidize. To arrive at this state, three more process steps are required, heating, depressurizing, and briquetting. After leaving the FB reactor, the reduced iron enters the flash heater, in which a stream of hot high-velocity hydrogen carries the DRI to the top of the plant while simultaneously heating it to a temperature of 685C. The DRI then enters the pressure let-down system, which takes the form of a seal leg. As the material passes down the seal leg, the hydrogen atmosphere is gradually replaced by inert nitrogen gas. On the way back up, the rising and friction reduce the pressure from the 3.7 bar to atmospheric pressure. Thus, pressure and hydrogen are removed in a reversal of the lock hopper process at the beginning. Hydrogen gas sensors assure that material leaving this step is free of hydrogen gas, and hence safe for briquetting. Each of the three briquetting machines contains two wheels that turn against each other, each wheel having one half of a briquette on its face. The DRI is poured onto the wheels from the top and is pressed into briquettes, or iron bars (see Figure 7). Mass Reduction A hundred tons of iron ore fed into the Circored process does not mean that 100 tons of HBI are obtained as the output of the briquetting machine. This is largely due to the evaporation of water and the reduction of the oxygen from the ore. These phenomena are referred to as "mass reduction". While there is a substantial amount of water in every metric ton of ore entering the pre-heater, the final HBI product is literally free of water. For this reason, a metric ton of ore entering the pre-heater contains only 924kg of dry ore leaving the pre-heater toward the lock hoppers. This 7.6% mass reduction at the pre-heater stage does not reflect an inefficiency of the production process, but represents the underlying mass balances as specified in the process recipe. Copyright 2002 INSEAD-Wharton, France/USA. Wharton INSEAD 5 5041 While no mass reduction occurs at the lock hopper stage, an additional 15% of mass is lost in the circulating fluid bed reactor, and a further 10% in the FB reactor. Both correspond to the weight of the oxygen that reacts with the hydrogen gas, producing water vapor as a by- product. The water is cooled and removed from the process in recycle gas scrubbers. Thus, 1 ton of ore flowing into the pre-heater corresponds to an inflow of 1000 kg*(1-.076) = 924 kg into the lock hoppers (and thus into the circulating fluid bed reactor), a 1000 kg*(1- .076)*(1-.15) = 785.4 kg inflow into the secondary reactor, and a 1000 kg*(1-.076)*(1- .15)*(1-.10) = 707 kg output of DRI to the flash heater. No further mass reduction occurs downstream from the secondary reactor. Exhibit 8 summarizes information on the mass balance of each of the Circored process steps. Process Performance: Yields and Uptime In addition to the anticipated effect of mass reduction, two operational problems prevented the plant from achieving its design load of 500k tons per year, and its design yield losses and machine down-time. Unlike mass reduction, yield losses resulted from inefficiencies in the plant operations. Potentially usable output was lost in the form of dust or other outflows. For example, 7% of the material moving from the flash heater to the discharge system were lost in this way. Another 3% of ore fines were lost in the briquetting machine. Yield losses, while small relative to the mass reduction, were of high managerial importance, as they increased the cost per ton of HBI produced. An improvement in the production yields would have two very desirable effects. First, it would reduce the amount of iron ore fines that were required to create a given amount of HBI. Thus, higher yields would use the production inputs more efficiently. Second, an improvement in production yield would also increase the output of the overall process, which, in turn, would allow the plant to spread its fixed costs over a higher volume of tonnage. See Exhibit 8 for detailed information on yield losses. The other operational reason for the plant's production shortfall, compared to its design load, can be explained by the substantial length of time the plant had to be shut down due to technical problems. Exhibit 9 gives a list of the availability for each process step. The other operational reason for the plant's production shortfall, compared to its design load, can be explained by the substantial length of time the plant had to be shut down due to technical problems. Exhibit 9 gives a list of the availability for each process step. While the technical availability of each process step might appear reasonably high, the Circored process required that all process steps be operational simultaneously in order to produce commercial output. This resulted from the fact that there were no significant buffers between the process steps that could absorb any machine failure which could not be fixed within one hour. For example, just the previous month, the plant had experienced a two-week shutdown because the gas support system had to be modified. Thus, while all other process steps, from pre-heater to briquetting, were fully functional, the entire plant had to be shut down. Design Load and Potential Improvements The throughput limiting step in the Circored process was the stationary fluidized bed reactor. Iron ore had to spend 4 hours in the reactor in order to achieve the desired 95% metallization. Copyright 2002 INSEAD-Wharton, France/USA. Wharton INSEAD 6 5041 This determined the flow through all the other steps, from the pre-heater to the briquetting machines. The engineers referred to the resulting flow rate as the design load. Yet, at the same time, they were optimistic that they would be able to increase the flow rate further by shortening the time the ore had to spend in the reactor. Specifically, they had developed plans that would shorten the reaction time to 3.5 hours. Another improvement opportunity that CAL had identified was linked to the substantial yield losses in the terminal stages of the process. In total, just over 10% (see Exhibit 8) of commercial quality DRI was lost, and engineers estimated that this could be reduced to 2% by feeding back into the system some of the fines that leaked out and were currently dumped. The benefit of this improvement project would be that the iron ore fed into the process would yield more HBI outflow, with all other inputs remaining unchanged. Thus, this project had the potential of substantially reducing the cost per ton produced. Nevertheless, the co-owners of the joint venture, CAL, viewed any additional investment as extremely risky, and could, hence, be persuaded otherwise only by fairly convincing returns. Cost Analysis The key performance measure that Cleveland Cliffs had to track in order to evaluate their HBI operations was the cost per ton of HBI. These costs contained two elements; variable production costs and fixed costs of the Trinidad plant. Variable production costs were largely driven by the main input into the Circored process, iron ore fines. At this time, the plant had to spend $47.50 on iron ore fines per ton of produced HBI. One ton iron ore fines, including shipping to Trinidad, cost $26.50. Because of mass reduction and yield losses, the plant currently consumed 1.79 tons of iron ore fines per ton of HBI produced, a number for which the Circored team had coined the phrase "the ore-to-HBI ratio". However, if production yields were to be improved, this ratio would have to be substantially reduced Exhibit Il summarizes the variable cost data as a function of the ore-to-HBI ratio. The most important variable cost drivers (apart from iron ore fines) were magnesium oxide, natural gas, hydrogen, nitrogen, electricity, water and sewer costs, and other oerating costs. These variables costs were incurred as follows: variable costs of iron ore fines and natural gas were computed based on the inflow at the preheater; variable costs for magnesium oxide were computed based on the inflow at the lock-hoppers; variable costs of hydrogen were computed based on the inflow at the 1st reactor; variable costs for electricity, water / sewer and other operating costs were computed based on the inflow at the 2nd reactor; and variable costs for nitrogen were computed based on the inflow at the discharge system. The most significant fixed costs of the plant were the overall depreciation of the production facility, which accounted for $7 million per year. Moreover, several contracts with external suppliers, including those for gas and electricity, amounted to a fixed annual "infrastructure" fee of $2.7 million. Finally, other fixed costs, such as maintenance, labor and administrative Copyright 2002 INSEAD-Wharton, France/USA. Wharton INSEAD 7 5041 overheads, accounted for an additional $10 million per annum. Exhibit 12 provides detailed information on the plant's fixed costs. While the initial projections for the DRI price had been close to $130/ton, the combination of the economic slow-down in mid-2001, together with the economic turbulence following the September 11 terrorist attack on the World Trade Center, left the DRI price at an unprecedented low of under $90 per ton (see Exhibit 13). While experts agreed that this figure would soon increase again, there existed substantial disagreement as to the rate of this recovery. In absence of a future market for DRI, some experts used a historical analysis of prices to forecast future price intervals (also Exhibit 13). These price scenarios ranged widely between $75 per ton and $155 per ton, making an accurate forecast almost impossible. A Commercial Future for Circored? At 7 am the next morning, Ed Dowling took the back seat in the car that drove him to the plant, weaving its way through the daily traffic jam that plagued the industrialized zone around Port of Spain. He had sketched out three scenarios that he wanted to discuss with Steve Elmquist. Under the most optimistic scenario, he assumed that prices would recover quickly from the all-time low they had reached in the Fall of 2001. Specifically, he assumed that prices (at the Trinidad dock) would be $110 per ton in 2002, $120 in 2003, and that the price would be back to its long-term average of $130 in the year 2004. On the operational side, this optimistic scenario assumed that the team would continue to improve the availability throughout the plant and, already the following year, achieve an up-time of 99% at each of the process steps. Moreover, the scenario assumed that the 3.5-hour reaction time in the stationary fluid bed reactor would be achieved by the year 2003. The second scenario was based on what Ed Dowling considered the most likely move of the market and technology. Under this scenario, prices would be somewhat slower to recover, and would move up by $10 in each of the following three years ($100 in 2002, $110 in 2003, $120 in 2004) and then stay at $120. On the operational side, he believed that the team could achieve an up-time of 99% at each of the process steps, but would get there only in 2003, while producing with the current up-time for the year 2002. With regard to the stationary fluidized bed reactor, he assumed that it would take until 2004 to achieve the desired 3.5 hour reaction time. In the worst case scenario, Ed Dowling saw prices remaining at $90 for another year and then gradually moving up by $5 in each of the following three years ($95 in 2002, $100 in 2003, $105 in 2004) and stay at $105 from there on. On the operational side, he assumed that the team would achieve an up-time of 99% at each of the process steps by the year 2004, while producing with the current up-time for the years 2002 and 2003. Moreover, he assumed that the reaction time in the stationary fluid bed reactor could be cut to 3.8 hours by the year 2004. Ed Dowling planned to use each of these scenarios to evaluate the three proposals that he and Steve Elmquist had presented the day before. Under proposal 1, no further investments in the plant would be made. This would involve laying off the entire workforce as well as imposing an immediate freeze on any engineering or administrative expenses. Copyright 2002 INSEAD-Wharton, France/USA. Wharton INSEAD 8 5041 Proposal 2 aimed at keeping the plant at its current status, to which CAL referred as the "cold idle status". This would keep a "skeleton" workforce on duty (and on the payroll), which created the option to rapidly (within one month) recommence production if the market recovered. Nevertheless, it would require an annual cash consumption of $6 million per year, which represented a major burden on Cleveland Cliffs' current financial situation. A slight modification of Proposal 2 was based on the idea of using the current idle period to further fine-tune the production recipe. Specifically, the team would be able to implement the yield improvement project without the disruptive effect it would have under normal operations. On the other hand, it would require an investment of an additional $2 million. There were 20 minutes left before the meeting was scheduled to start. Ed Dowling looked out from the conference room at the 220-foot tower of the pressure-let-down system, and reflected on the last two years that he and the others on the CAL team had spent solving numerous technical problems, several of which had been deemed impossible to solve by some of the world's leading metallurgists. "Could all of this have been for nothing?" he wondered, and closed the curtains to focus on the figures in front of him. Wharton INSEAD (in millions, Year Ended December 31 REVENUES Product sales and services Royalties and management fees Total Operating Revenues Insurance recovery Interest income Other income Total Revenues COSTS AND EXPENSES Cost of goods sold and operating expenses Administrative, selling and general expenses Write-down of common stock investment Pre-operating loss of Cliffs and Associates Limited Interest expense Other expenses Total Costs and Expenses INCOME BEFORE INCOME TAXES INCOME TAXES (CREDIT) NET INCOME ASSETS CURRENT ASSETS Exhibit 2 Earnings Statement of Cleveland Cliffs Inc. Cash and cash equivalents Trade accounts receivable Receivables from assoc. companies Product inventories - iron ore Supplies and other inventories Deferred and refundable income taxes Other TOTAL CURRENT ASSETS PROPERTIES Plant and equipment Minerals OTHER ASSETS Prepaid pensions Miscellaneous Allowances depreciation and depletion TOTAL PROPERTIES INVESTMENTS IN ASSOCIATED COMPANIES TOTAL OTHER ASSETS TOTAL ASSETS Copyright 2002 INSEAD-Wharton, France/USA. 2000 Exhibit 3 Balance Sheet of Cleveland Cliffs Inc. $29.9 46.3 18.5 90.8 22.4 27.3 12.8 248.0 10 337.7 19.2 356.9 (84.2) 272.7 138.4 38.1 30.6 68.7 $727.8 1999 $67.6 66.0 16.6 36.6 16.0 7.7 6.6 217.1 204.9 19.1 224.0 (70.1) 153.9 233.4 40.8 34.5 75.3 $ 679.7 2000 $ 379.4 50.7 Accrued expenses Taxes payable Other 430.1 15.3 2.9 6.7 455.0 380.2 18.7 10.9 13.3 4.9 10.4 438.4 16.6 (1.5) $ 18.1 LIABILITIES AND SHAREHOLDERS' EQUITY LONG TERM DEBT CURRENT LIABILITIES Trade accounts payable Payables to associated companies TOTAL CURRENT LIABILITIES POSTEMPLOYMENT BENEFIT LIABILITIES OTHER LIABILITIES 1999 MINORITY INTEREST IN CLIFFS AND ASSOCIATED LIMITED TOTAL SHAREHOLDERS EQUITY TOTAL LIABILITIES AND SHAREHOLDERS' EQUITY $ 316.1 48.5 364.6 3.0 3.4 371.0 329.3 16.1 8.8 3.7 8.4 366.3 4.7 (.1) $4.8 2000 $ 12.4 22.7 44.1 16.1 6.9 102.2 70.0 71.7 58.0 23.9 402.0 $ 727.8 1998 $ 465.7 49.7 515.4 5.4 4.7 525.5 419.6 18.7 2.3 .4 12.7 453.7 71.8 14.4 $ 57.4 1999 $9.5 19.6 30.3 9.8 4.5 73.7 70.0 68.1 60.6 407.3 $ 679.7 5041 Wharton INSEAD Off Gas Scrubber Iron Ore Cyclone 2 to Thickener Venturi 1 Cyclone 1 Solids - Gas Outflow Due to Mass reduction Pre-Heater Inflow of iron ore fines Tray Conveyor TEALLIANCE Fuel Copyright 2002 INSEAD-Wharton, France/USA. Feed System Air CFB Stage I Exhibit 4 The Circored Process Secondary Process Gas Process Heater Fluidized Bed Stage II Lock Hoppers 11 Fuel Recycle Cyclone Flash Heater Air Fuel Exhibit 5 Process Flow Diagram Outflow Due to Mass reduction DRI Discharge System Fines 1st Reactor Recycle Briquetting Make-up Gas HBI Multi- clone Outflow Due to Mass reduction 2nd Reactor Flash Heater Discharge Process Liit Briquetting Outflow of HBI Heat Exchangers to Thickener EAF Process Gas ubber Process Gas Compressor 5041 Bleed as Fuel Hot Charging Option I Outflow Due to Yield loss Outflow Due to Yield loss Outflow Due to Yield loss Wharton INSEAD Pre-heater Lock Hoppers 1st Reactor 2nd Reactor Flash Heater Copyright 2002 INSEAD-Wharton, France/USA. Exhibit 8 Flow Losses per Process Step Discharge System Briquetting PROCESS GAS BOON RECL Mass Reduction (%) 44 10% 00100% OHOON 14 Pre-heater Lock Hoppers Reactor 2nd Reactor Flash Heater Discharge System Briquetting 7.6 0.0 15.0 Exhibit 9 View of a Screen in the Control Room 10.0 0.0 0.0 0.0 Yield Loss (%) Exhibit 10 Machine Downtime per Process Step 1 5.0 0.0 7.0 1.0 7.0 0.0 3.0 Machine Downtime (%) 10 5041 Wharton INSEAD Exhibit 11 Variable Production Costs (note that these variable costs are incurred based on the inflow of ore at the various resources consuming the input material, not just on the overall production level) Variable cost Wharton INSEAD Iron ore fine Magnesium oxide Natural gas. Hydrogen Nitrogen Electricity Water and sewer Operating costs Copyright 2002 INSEAD-Wharton, France/USA. Fixed costs Hydrogen Electricity Labor Maintenance Land and property taxes Overhead, travel Other administrative costs Depreciation Total 16 Cost per ton DRI [$/ton] $26.50/ ton of fines times ore-to-DRI ratio 1.50 10.86 8.08 3.51 4.25 2.52 1.83 Exhibit 12 Fixed Production Costs Cost per year [$ million/year] 1.700 1.050 3.815 2.910 0.720 2.500 0.960 7.135 20.790 5041 Wharton INSEAD 220 200 Copright2002 INSEAD-Whee, Free USA 180 160 140 120 Fixed costs 100 Hydrogen Electricity Labor Maintenance Land and property taxes Overhead, travel Other administrative costs Depreciation Total Exhibit 12 Fixed Production Costs T 80 Jan Jan Jan Jan Jan Jan Jan 89 90 91 92 93 94 95 Source: Dealer Bundles Price, Chicago Market (S/ton) From [$/ton] 70 80 90 100 Cost per year [$ million/year] 1.700 1.050 3.815 17 Exhibit 13 Historical Prices for HBI and estimated probability for future price scenarios 110 120 130 140 150 2.910 0.720 2.500 0.960 7.135 To [S/ton) 80 90 100 110 120 130 140 150 160 20.790 The following Table includes price intervals ([From,To]) and their estimated probability of occurrence for the future Jan Jan Jan Jan Jan Jan Jan 96 97 98 99 02 Probability 7.1% 7.1% 0.0% 21.4% 7.1% 7.1% 0.0% 21.4% 28.6% 5041 Note: the estimation. based on the assumption that future prices will follow the same distribution as historical prices; based on this assumption, the table summarizes the frequency of historical price scenarios as a forecast for future price scenarios.
Step by Step Solution
There are 3 Steps involved in it
To address the questions outlined in this case we need to evaluate the operations and longterm strategy of Cleveland Cliffs plant and make recommendat... View full answer

Get step-by-step solutions from verified subject matter experts