

Question: INTRODUCTION This is an individual major assignment using MS Excel. The breakdown marks of tasks are as follows: Required Tasks % Use of Relative &
INTRODUCTION
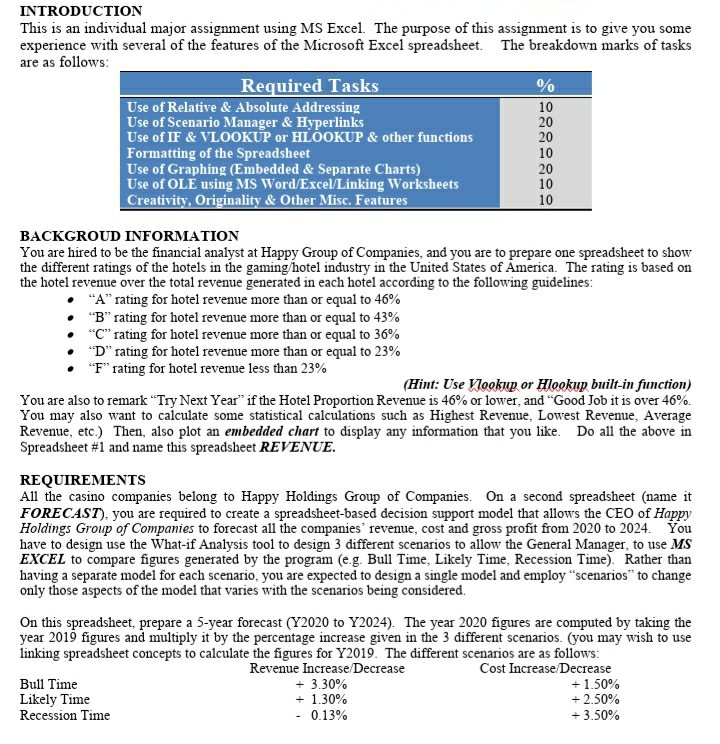
This is an individual major assignment using MS Excel. The breakdown marks of tasks are as follows:
Required Tasks
%
Use of Relative & Absolute Addressing
10
Use of Scenario Manager & Hyperlinks
20
Use of IF & VLOOKUP or HLOOKUP & other functions
20
Formatting of the Spreadsheet
10
Use of Graphing (Embedded & Separate Charts)
20
Use of OLE using MS Word/Excel/Linking Worksheets
10
Creativity, Originality & Other Misc. Features
10
BACKGROUD INFORMATION You are hired to be the financial analyst at Happy Group of Companies, and you are to prepare one spreadsheet to show the different ratings of the hotels in the gaming/hotel industry in the United States of America. The rating is based on the hotel revenue over the total revenue generated in each hotel according to the following guidelines: A rating for hotel revenue more than or equal to 46% B rating for hotel revenue more than or equal to 43% C rating for hotel revenue more than or equal to 36% D rating for hotel revenue more than or equal to 23% F rating for hotel revenue less than 23% (Hint: Use Vlookup or Hlookup built-in function) You are also to remark Try Next Year if the Hotel Proportion Revenue is 46% or lower, and Good Job it is over 46%. You may also want to calculate some statistical calculations such as Highest Revenue, Lowest Revenue, Average Revenue, etc.) Then, also plot an embedded chart to display any information that you like. Do all the above in Spreadsheet #1 and name this spreadsheet REVENUE. REQUIREMENTS All the casino companies belong to Happy Holdings Group of Companies. On a second spreadsheet (name it FORECAST), you are required to create a spreadsheet-based decision support model that allows the CEO of Happy Holdings Group of Companies to forecast all the companies revenue, cost and gross profit from 2020 to 2024. You have to design use the What-if Analysis tool to design 3 different scenarios to allow the General Manager, to use MS EXCEL to compare figures generated by the program (e.g. Bull Time, Likely Time, Recession Time). Rather than having a separate model for each scenario, you are expected to design a single model and employ scenarios to change only those aspects of the model that varies with the scenarios being considered. On this spreadsheet, prepare a 5-year forecast (Y2020 to Y2024). The year 2020 figures are computed by taking the year 2019 figures and multiply it by the percentage increase given in the 3 different scenarios. (you may wish to use linking spreadsheet concepts to calculate the figures for Y2019. The different scenarios are as follows: Revenue Increase/Decrease Cost Increase/Decrease Bull Time + 3.30% + 1.50% Likely Time + 1.30% + 2.50% Recession Time - 0.13% + 3.50% The Y2019 Total Cost of Operations For Happy Holdings group of companies is $7,999M and will increase/decrease annually according to the above scenarios. The gross profit is calculated by taking the difference between the Total Revenue generated by the different hotels MINUS the Total Cost of Operations. You may wish to plot a bar chart (Separate chart) to display the gross profit over the 5 years using the Recession Time Scenario. Also insert a graphic in the spreadsheet and create a hyperlink for user to click on the graphic and it will bring the user to an appropriate web-site that might be useful for the manager. The company CEO decided to borrow a one-time loan of $5,000M in Jan 2020 to bring the company out of the woods. Compute the gross profit in each scenario. On a separate row, add in the Loan amount in 2020. Given the bank charges 3.20% interest rate and the company wishes to borrow for 5-year term, add another row for Annual Payment to the bank (Happy Group of Companies chooses to pay monthly payment, calculate the total 12 monthly payments using the appropriate built-in functions and formula.) Then compute the Accumulated Cash Flow from 2020 to 2024 (taking in consideration the loss in 2019 as well as the loan and 12 monthly bank payments). You DO NOT need to worry about the Present Value/Future Value concepts (just to keep the assignment simple). Also prepare a memo as a GM to the CEO using MS Word (together with data and charts from MS Excel) to advice and comments on the sales figures projected based on the scenario using the recession time scenario. DESIGN ISSUES Never use a number in a formula and try to plan your spreadsheet so that it can be re-used in the future. SUBMISSION You are required to e-mail the following to me with the e-mail subject (example FirstName_LastName_Campus) (example: your subject line should read JohnSmith_NW or JohnSmith_DL):
Happy.xlsx which will contain 2 spreadsheets (revenue & forecast as well as a separate chart)
Memo.docx memo written to your CEO
You should also make a backup of the system; late submissions will not be graded.
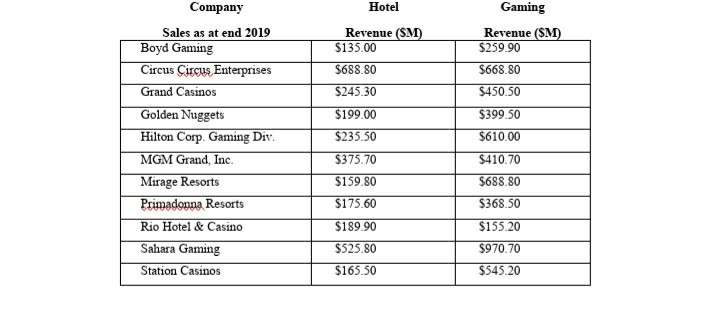
DATA : You MUST use the following data for your assignments.
Company
Hotel
Gaming
Sales as at end 2019
Revenue ($M)
Revenue ($M)
Boyd Gaming $135.00 $259.90 Circus Circus Enterprises $688.80 $668.80 Grand Casinos $245.30 $450.50 Golden Nuggets $199.00 $399.50 Hilton Corp. Gaming Div. $235.50 $610.00 MGM Grand, Inc. $375.70 $410.70 Mirage Resorts $159.80 $688.80 Primadonna Resorts $175.60 $368.50 Rio Hotel & Casino $189.90 $155.20 Sahara Gaming $525.80 $970.70 Station Casinos $165.50 $545.20
% INTRODUCTION This is an individual major assignment using MS Excel. The purpose of this assignment is to give you some experience with several of the features of the Microsoft Excel spreadsheet. The breakdown marks of tasks are as follows: Required Tasks Use of Relative & Absolute Addressing 10 Use of Scenario Manager & Hyperlinks 20 Use of IF & VLOOKUP or HLOOKUP & other functions 20 Formatting of the Spreadsheet 10 Use of Graphing (Embedded & Separate Charts) 20 Use of OLE using MS Word/Excel/Linking Worksheets 10 Creativity, Originality & Other Misc. Features 10 BACKGROUD INFORMATION You are hired to be the financial analyst at Happy Group of Companies, and you are to prepare one spreadsheet to show the different ratings of the hotels in the gaming hotel industry in the United States of America. The rating is based on the hotel revenue over the total revenue generated in each hotel according to the following guidelines: "A" rating for hotel revenue more than or equal to 46% B rating for hotel revenue more than or equal to 43% "C" rating for hotel revenue more than or equal to 36% "D" rating for hotel revenue more than or equal to 23% "F" rating for hotel revenue less than 23% (Hint: Use Vookup or Hlookup built-in function) You are also to remark "Try Next Year if the Hotel Proportion Revenue is 46% or lower, and "Good Job it is over 46%. You may also want to calculate some statistical calculations such as Highest Revenue, Lowest Revenue, Average Revenue, etc.) Then, also plot an embedded chart to display any information that you like. Do all the above in Spreadsheet #1 and name this spreadsheet REVENUE. REQUIREMENTS All the casino companies belong to Happy Holdings Group of Companies. On a second spreadsheet (name it FORECAST), you are required to create a spreadsheet-based decision support model that allows the CEO of Happy Holdings Group of Companies to forecast all the companies' revenue, cost and gross profit from 2020 to 2024. You have to design use the What-if Analysis tool to design 3 different scenarios to allow the General Manager, to use MS EXCEL to compare figures generated by the program (e.g. Bull Time, Likely Time, Recession Time). Rather than having a separate model for each scenario, you are expected to design a single model and employ "scenarios" to change only those aspects of the model that varies with the scenarios being considered. On this spreadsheet, prepare a 5-year forecast (Y2020 to Y2024). The year 2020 figures are computed by taking the year 2019 figures and multiply it by the percentage increase given in the 3 different scenarios. (you may wish to use linking spreadsheet concepts to calculate the figures for Y2019. The different scenarios are as follows: Revenue Increase Decrease Cost Increase Decrease Bull Time + 3.30% + 1.50% Likely Time + 1.30% +2.50% Recession Time - 0.13% +3.50% The Y2019 Total Cost of Operations For Happy Holdings group of companies is $7,999M and will increase decrease annually according to the above scenarios. The gross profit is calculated by taking the difference between the Total Revenue generated by the different hotels MINUS the Total Cost of Operations. You may wish to plot a bar chart (Separate chart) to display the gross profit over the 5 years using the Recession Time Scenario. Also insert a graphic in the spreadsheet and create a hyperlink for user to click on the graphic and it will bring the user to an appropriate web-site that might be useful for the manager. The company CEO decided to borrow a one- time loan of $5,000M in Jan 2020 to bring the company "out of the woods. Compute the gross profit in each scenario. On a separate row, add in the Loan amount in 2020. Given the bank charges 3.20% interest rate and the company wishes to borrow for 5-year term, add another row for Annual Payment to the bank (Happy Group of Companies chooses to pay monthly payment, calculate the total 12 monthly payments using the appropriate built-in functions and formula.) Then compute the Accumulated Cash Flow from 2020 to 2024 (taking in consideration the loss in 2019 as well as the loan and 12 monthly bank payments). You DO NOT need to worry about the Present Value/Future Value concepts (just to keep the assignment simple). Also prepare a memo as a GM to the CEO using MS Word (together with data and charts from MS Excel) to "advice" and comments on the sales figures projected based on the scenario using the recession time scenario. DESIGN ISSUES Never use a number in a formula and try to plan your spreadsheet so that it can be re-used in the future. Hotel Revenue (SM) $135.00 Gaming Revenue (SM) $259.90 $668.80 $688.80 $450.50 $245.30 $199.00 Company Sales as at end 2019 Boyd Gaming Circus Circus Enterprises Grand Casinos Golden Nuggets Hilton Corp. Gaming Div. MGM Grand, Inc. Mirage Resorts Primadonna Resorts Rio Hotel & Casino Sahara Gaming Station Casinos $399.50 $610.00 $235.50 $375.70 $410.70 $688.80 $159.80 $175.60 $368.50 $155.20 $189.90 $525.80 $970.70 $545.20 $165.50 % INTRODUCTION This is an individual major assignment using MS Excel. The purpose of this assignment is to give you some experience with several of the features of the Microsoft Excel spreadsheet. The breakdown marks of tasks are as follows: Required Tasks Use of Relative & Absolute Addressing 10 Use of Scenario Manager & Hyperlinks 20 Use of IF & VLOOKUP or HLOOKUP & other functions 20 Formatting of the Spreadsheet 10 Use of Graphing (Embedded & Separate Charts) 20 Use of OLE using MS Word/Excel/Linking Worksheets 10 Creativity, Originality & Other Misc. Features 10 BACKGROUD INFORMATION You are hired to be the financial analyst at Happy Group of Companies, and you are to prepare one spreadsheet to show the different ratings of the hotels in the gaming hotel industry in the United States of America. The rating is based on the hotel revenue over the total revenue generated in each hotel according to the following guidelines: "A" rating for hotel revenue more than or equal to 46% B rating for hotel revenue more than or equal to 43% "C" rating for hotel revenue more than or equal to 36% "D" rating for hotel revenue more than or equal to 23% "F" rating for hotel revenue less than 23% (Hint: Use Vookup or Hlookup built-in function) You are also to remark "Try Next Year if the Hotel Proportion Revenue is 46% or lower, and "Good Job it is over 46%. You may also want to calculate some statistical calculations such as Highest Revenue, Lowest Revenue, Average Revenue, etc.) Then, also plot an embedded chart to display any information that you like. Do all the above in Spreadsheet #1 and name this spreadsheet REVENUE. REQUIREMENTS All the casino companies belong to Happy Holdings Group of Companies. On a second spreadsheet (name it FORECAST), you are required to create a spreadsheet-based decision support model that allows the CEO of Happy Holdings Group of Companies to forecast all the companies' revenue, cost and gross profit from 2020 to 2024. You have to design use the What-if Analysis tool to design 3 different scenarios to allow the General Manager, to use MS EXCEL to compare figures generated by the program (e.g. Bull Time, Likely Time, Recession Time). Rather than having a separate model for each scenario, you are expected to design a single model and employ "scenarios" to change only those aspects of the model that varies with the scenarios being considered. On this spreadsheet, prepare a 5-year forecast (Y2020 to Y2024). The year 2020 figures are computed by taking the year 2019 figures and multiply it by the percentage increase given in the 3 different scenarios. (you may wish to use linking spreadsheet concepts to calculate the figures for Y2019. The different scenarios are as follows: Revenue Increase Decrease Cost Increase Decrease Bull Time + 3.30% + 1.50% Likely Time + 1.30% +2.50% Recession Time - 0.13% +3.50% The Y2019 Total Cost of Operations For Happy Holdings group of companies is $7,999M and will increase decrease annually according to the above scenarios. The gross profit is calculated by taking the difference between the Total Revenue generated by the different hotels MINUS the Total Cost of Operations. You may wish to plot a bar chart (Separate chart) to display the gross profit over the 5 years using the Recession Time Scenario. Also insert a graphic in the spreadsheet and create a hyperlink for user to click on the graphic and it will bring the user to an appropriate web-site that might be useful for the manager. The company CEO decided to borrow a one- time loan of $5,000M in Jan 2020 to bring the company "out of the woods. Compute the gross profit in each scenario. On a separate row, add in the Loan amount in 2020. Given the bank charges 3.20% interest rate and the company wishes to borrow for 5-year term, add another row for Annual Payment to the bank (Happy Group of Companies chooses to pay monthly payment, calculate the total 12 monthly payments using the appropriate built-in functions and formula.) Then compute the Accumulated Cash Flow from 2020 to 2024 (taking in consideration the loss in 2019 as well as the loan and 12 monthly bank payments). You DO NOT need to worry about the Present Value/Future Value concepts (just to keep the assignment simple). Also prepare a memo as a GM to the CEO using MS Word (together with data and charts from MS Excel) to "advice" and comments on the sales figures projected based on the scenario using the recession time scenario. DESIGN ISSUES Never use a number in a formula and try to plan your spreadsheet so that it can be re-used in the future. Hotel Revenue (SM) $135.00 Gaming Revenue (SM) $259.90 $668.80 $688.80 $450.50 $245.30 $199.00 Company Sales as at end 2019 Boyd Gaming Circus Circus Enterprises Grand Casinos Golden Nuggets Hilton Corp. Gaming Div. MGM Grand, Inc. Mirage Resorts Primadonna Resorts Rio Hotel & Casino Sahara Gaming Station Casinos $399.50 $610.00 $235.50 $375.70 $410.70 $688.80 $159.80 $175.60 $368.50 $155.20 $189.90 $525.80 $970.70 $545.20 $165.50
Step by Step Solution
There are 3 Steps involved in it

Get step-by-step solutions from verified subject matter experts