

Question: INTRODUCTION TO STATISTICAL METHODS Each question carries 2 Marks (5 x 2 = 10 Marks) 1. An insurance agent has claimed that the average age
INTRODUCTION TO STATISTICAL METHODS
Each question carries 2 Marks (5 x 2 = 10 Marks) 1. An insurance agent has claimed that the average age of policy holders who insure through him is less than the average for all the agents, which is 35 years. A random sample of 40 policy holders who insured through him gave an average of 32 years with the standard error of 2 years. Using at 5% level of significance, ascertain whether the insurance agents claim is justified? Also find P-value. 2. In a sample of 10 observations the sum of squares of deviation of the sample values from the sample mean was 120 and another sample of 12 observations, it was found to be 614. Test whether the differences of variances is significant at 5%. 3. Mechanical engineers testing a new arc welding technique, classified welds both with respect to appearance and an X-ray inspection
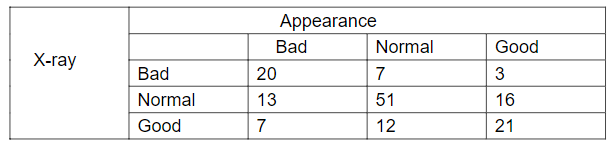
Test for independence using 0.05 level of significance. 4. Three brands of flashlight batteries are to be compared by testing each brand in 4 flashlights. Twelve flashlights are randomly selected and divided randomly into three groups of four flashlights each. Then each group of flashlights uses a different brand of battery. The lifetimes of the batteries, to the nearest hour, are as follows.
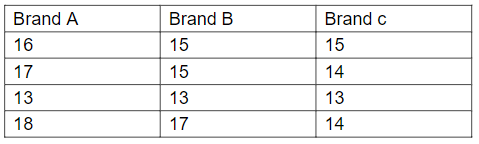
Preliminary data analyses indicate that the independent samples come from normal populations with equal standard deviations. At the 5% significance level, does there appear to be a difference in mean lifetime among the three brands of batteries? 5. Calculate the two regression equations on X on Y and Y on X from the data given below, taking deviations from a actual means of X and Y. 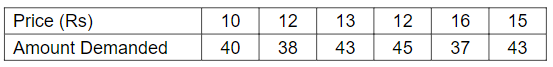 Estimate the likely demand when the price is Rs.20.
\begin{tabular}{|l|l|l|l|l|} \hline \multirow{3}{*}{ X-ray } & \multicolumn{4}{|c|}{ Appearance } \\ \cline { 2 - 5 } & & \multicolumn{1}{|c|}{ Bad } & Normal & Good \\ \cline { 2 - 6 } & Bad & 20 & 7 & 3 \\ \cline { 2 - 6 } & Normal & 13 & 51 & 16 \\ \cline { 2 - 6 } & Good & 7 & 12 & 21 \\ \hline \end{tabular} \begin{tabular}{|l|l|l|} \hline Brand A & Brand B & Brand c \\ \hline 16 & 15 & 15 \\ \hline 17 & 15 & 14 \\ \hline 13 & 13 & 13 \\ \hline 18 & 17 & 14 \\ \hline \end{tabular} \begin{tabular}{|l|r|r|r|r|r|r|} \hline Price (Rs) & 10 & 12 & 13 & 12 & 16 & 15 \\ \hline Amount Demanded & 40 & 38 & 43 & 45 & 37 & 43 \\ \hline \end{tabular}
Step by Step Solution
There are 3 Steps involved in it

Get step-by-step solutions from verified subject matter experts