

Question: Introduction to Statistics This PERFORMANCE ASSESSMENT TASK is designed to assess the learner's ability to calculate the measures of central tendencies, plot the five-number summary,
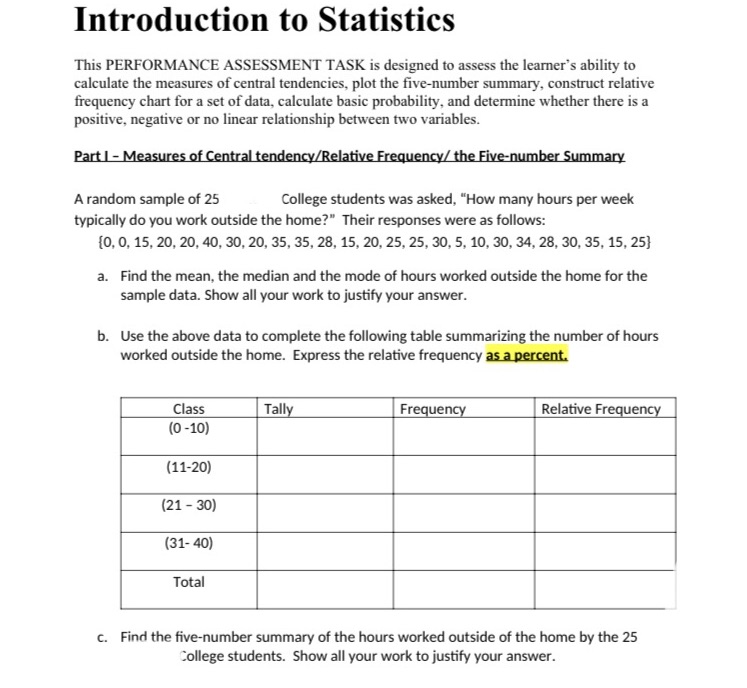
Introduction to Statistics This PERFORMANCE ASSESSMENT TASK is designed to assess the learner's ability to calculate the measures of central tendencies, plot the five-number summary, construct relative frequency chart for a set of data, calculate basic probability, and determine whether there is a positive, negative or no linear relationship between two variables. Part I - Measures of Central tendency/Relative Frequency/ the Five-number Summary A random sample of 25 College students was asked, "How many hours per week typically do you work outside the home?" Their responses were as follows: {0, 0, 15, 20, 20, 40, 30, 20, 35, 35, 28, 15, 20, 25, 25, 30, 5, 10, 30, 34, 28, 30, 35, 15, 25} a. Find the mean, the median and the mode of hours worked outside the home for the sample data. Show all your work to justify your answer. b. Use the above data to complete the following table summarizing the number of hours worked outside the home. Express the relative frequency as a percent. Class Tally Frequency Relative Frequency (0-10) (11-20) (21 - 30) (31-40) Total c. Find the five-number summary of the hours worked outside of the home by the 25 College students. Show all your work to justify your
Step by Step Solution
There are 3 Steps involved in it

Get step-by-step solutions from verified subject matter experts