

Question: Inventory Analysis Company Name Beginning Inventory Value Year End Inventory Value Annual Cost of Goods Sold Days to Turnover Inventory Inventory Turnover Ratio Design a
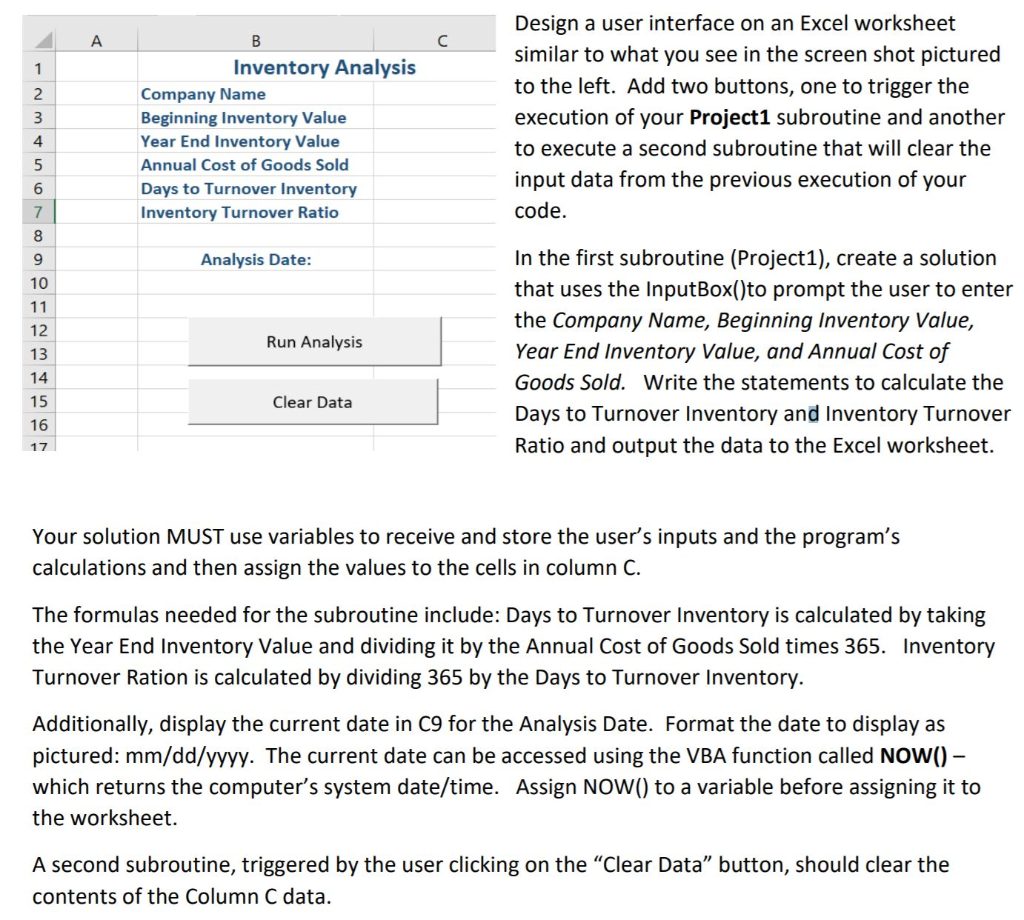

Inventory Analysis Company Name Beginning Inventory Value Year End Inventory Value Annual Cost of Goods Sold Days to Turnover Inventory Inventory Turnover Ratio Design a user interface on an Excel worksheet similar to what you see in the screen shot pictured to the left. Add two buttons, one to trigger the execution of your Project1 subroutine and another to execute a second subroutine that will clear the input data from the previous execution of your code. Analysis Date: Run Analysis In the first subroutine (Project1), create a solution that uses the InputBox()to prompt the user to enter the Company Name, Beginning Inventory Value, Year End Inventory Value, and Annual Cost of Goods Sold. Write the statements to calculate the Days to Turnover Inventory and Inventory Turnover Ratio and output the data to the Excel worksheet. Clear Data 17 Your solution MUST use variables to receive and store the user's inputs and the program's calculations and then assign the values to the cells in column C. The formulas needed for the subroutine include: Days to Turnover Inventory is calculated by taking the Year End Inventory Value and dividing it by the Annual Cost of Goods Sold times 365. Inventory Turnover Ration is calculated by dividing 365 by the Days to Turnover Inventory. Additionally, display the current date in C9 for the Analysis Date. Format the date to display as pictured: mm/dd/yyyy. The current date can be accessed using the VBA function called NOW() - which returns the computer's system date/time. Assign NOW() to a variable before assigning it to the worksheet. A second subroutine, triggered by the user clicking on the "Clear Data" button, should clear the contents of the Column C data. Your output should be formatted to look similar to the screen shot below: B Inventory Analysis Company Name Republic Mfg Beginning Inventory Value $35,386 Year End Inventory Value $5,898 Annual Cost of Goods Sold $29,488 Days to Turnover Inventory 73 Inventory Turnover Ratio Notice the BOLD, Blue Font for the labels in column B, the centering of the data in Column C. Also notice the numeric formatting applied to cells C3 through C5 to display the values with no decimal places and the Analysis Date displayed with a mm/dd/yyyy format. 5 Save your file as an Excel macro-enabled workbook named as specified above and upload the solution to Blackboard. Be sure to Analysis Date: 02/11/2020 Inventory Analysis Company Name Beginning Inventory Value Year End Inventory Value Annual Cost of Goods Sold Days to Turnover Inventory Inventory Turnover Ratio Design a user interface on an Excel worksheet similar to what you see in the screen shot pictured to the left. Add two buttons, one to trigger the execution of your Project1 subroutine and another to execute a second subroutine that will clear the input data from the previous execution of your code. Analysis Date: Run Analysis In the first subroutine (Project1), create a solution that uses the InputBox()to prompt the user to enter the Company Name, Beginning Inventory Value, Year End Inventory Value, and Annual Cost of Goods Sold. Write the statements to calculate the Days to Turnover Inventory and Inventory Turnover Ratio and output the data to the Excel worksheet. Clear Data 17 Your solution MUST use variables to receive and store the user's inputs and the program's calculations and then assign the values to the cells in column C. The formulas needed for the subroutine include: Days to Turnover Inventory is calculated by taking the Year End Inventory Value and dividing it by the Annual Cost of Goods Sold times 365. Inventory Turnover Ration is calculated by dividing 365 by the Days to Turnover Inventory. Additionally, display the current date in C9 for the Analysis Date. Format the date to display as pictured: mm/dd/yyyy. The current date can be accessed using the VBA function called NOW() - which returns the computer's system date/time. Assign NOW() to a variable before assigning it to the worksheet. A second subroutine, triggered by the user clicking on the "Clear Data" button, should clear the contents of the Column C data. Your output should be formatted to look similar to the screen shot below: B Inventory Analysis Company Name Republic Mfg Beginning Inventory Value $35,386 Year End Inventory Value $5,898 Annual Cost of Goods Sold $29,488 Days to Turnover Inventory 73 Inventory Turnover Ratio Notice the BOLD, Blue Font for the labels in column B, the centering of the data in Column C. Also notice the numeric formatting applied to cells C3 through C5 to display the values with no decimal places and the Analysis Date displayed with a mm/dd/yyyy format. 5 Save your file as an Excel macro-enabled workbook named as specified above and upload the solution to Blackboard. Be sure to Analysis Date: 02/11/2020
Step by Step Solution
There are 3 Steps involved in it

Get step-by-step solutions from verified subject matter experts