

Question: INVESTIGATION: CONSTRUCTING A HISTOGRAM The table represents daily temperature readings for July in a certain city. Day 1 3 4 5 6 7 9 10
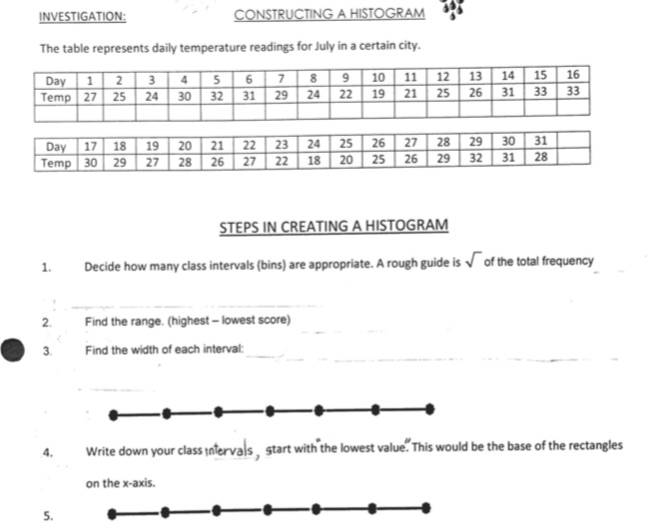
INVESTIGATION: CONSTRUCTING A HISTOGRAM The table represents daily temperature readings for July in a certain city. Day 1 3 4 5 6 7 9 10 11 12 13 14 15 16 Temp 27 25 24 30 32 31 29 24 22 19 21 25 26 31 3.3 33 Day 17 18 19 20 21 22 23 24 25 26 27 28 29 30 31 Temp 30 29 27 28 26 27 22 18 20 25 26 29 32 31 28 STEPS IN CREATING A HISTOGRAM 1. Decide how many class intervals (bins) are appropriate. A rough guide is v of the total frequency 2 Find the range. (highest - lowest score) 3 Find the width of each interval: Write down your class intervals, start with the lowest value. This would be the base of the rectangles on the x-axis
Step by Step Solution
There are 3 Steps involved in it

Get step-by-step solutions from verified subject matter experts