Question: ions Management Fall20 Which tool is very useful in documenting and presenting the whole process Select one: O a. Pareto chart O b. histogram on
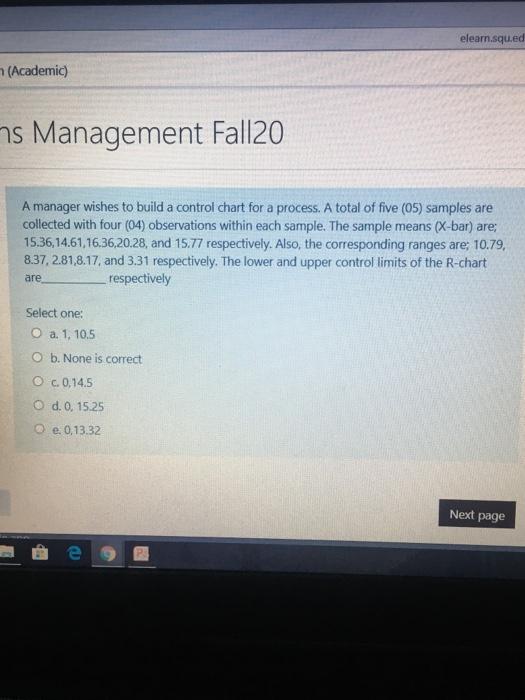
ions Management Fall20 Which tool is very useful in documenting and presenting the whole process Select one: O a. Pareto chart O b. histogram on O c. check sheet O d. control chart O e. flow chart page ations Management Fall20 6 A manager wishes to build a control chart for a process. A total of five (05) samples are collected with four (04) observations within each sample. The sample means (X-bar) are: 15.36, 14.61,16.36,20.28, and 15.77 respectively. Also, the corresponding ranges are: 10.79, 8.37, 2.81,8.17, and 3.31 respectively. The lower and upper control limits of the x-bar chart are respectively out of question Select one: a. 11.59, 21.36 O b. 16.55, 11.47 c None is correct d. 18.55, 13.47 e e. 12.40, 19.72 Next page vious page ons Management Fall20 The process of assigning tasks to workstations in such a way that the workstations have approximately equal time requirements is Select one: O a. cycle time optimization O b. none of these o c. idle time analysis O d. fair employment practices e line balancing Next page page ons Management Fall20 Tabulated form of list showing the number of occurrences by the category is widely used in Select one: O a. None is correct O b. Ishikawa diagram n O c. interviewing O d. cause-and-effect diagrams e. Pareto analysis Next page age System (Academic) tions Management Fall20 Cycle time should always be between the shortest and the longest task times in a production cycle of Select one: O a. TRUE stion O b. FALSE Next page 5 page elearn.squ.ed (Academic) 7s Management Fall20 A manager wishes to build a control chart for a process. A total of five (05) samples are collected with four (04) observations within each sample. The sample means (X-bar) are; 15.36,14.61,16,36,20.28, and 15.77 respectively. Also, the corresponding ranges are; 10.79, 8.37, 2.81.8.17, and 3.31 respectively. The lower and upper control limits of the R-chart are respectively Select one: O a. 1. 10.5 O b. None is correct O c. 0,14.5 O d.o. 15.25 e. 0,13.32 Next page e 7s Management Fall20 In a manufacturing system, the technique of deciding how to assign work to specific work stations (machines) is referred to as Select one: O a. task allocation O b. work allocation c. station allocation d. line balancing 0e. process balancing Next page