

Question: irZiThe figure shows a line graph. The graph is labeled 'X' on the horizontal axis with increments from left to right of *1 ,0,1 ,2,3.
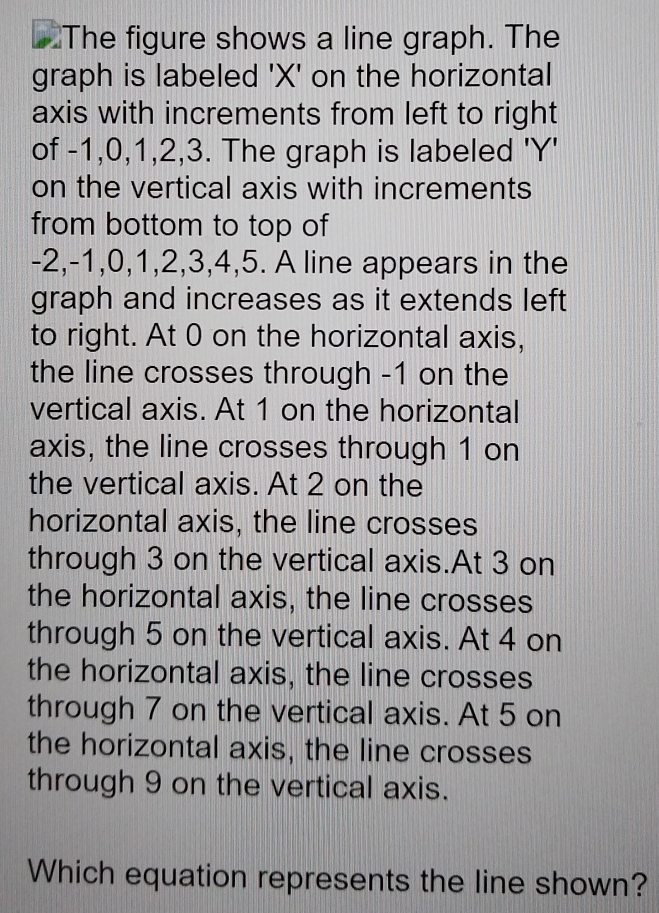
irZiThe figure shows a line graph. The graph is labeled 'X' on the horizontal axis with increments from left to right of *1 ,0,1 ,2,3. The graph is labeled 'Y' on the vertical axis with increments from bottom to top of 2,1,0,1,2,3,4,5. A line appears in the graph and increases as it extends left to right. At 0 on the horizontal axis, the line crosses through 1 on the vertical axis. At 1 on the horizontal axis, the line crosses through 1 on the vertical axis. At 2 on the horizontal axis, the line crosses through 3 on the vertical axis.At 3 on the horizontal axis, the line crosses through 5 on the vertical axis. At 4 on the horizontal axis, the line crosses
Step by Step Solution
There are 3 Steps involved in it

Get step-by-step solutions from verified subject matter experts