

Question: Is a statistics class' delivery type a factor in how well students do on the final exam? The table below shows the average percent on
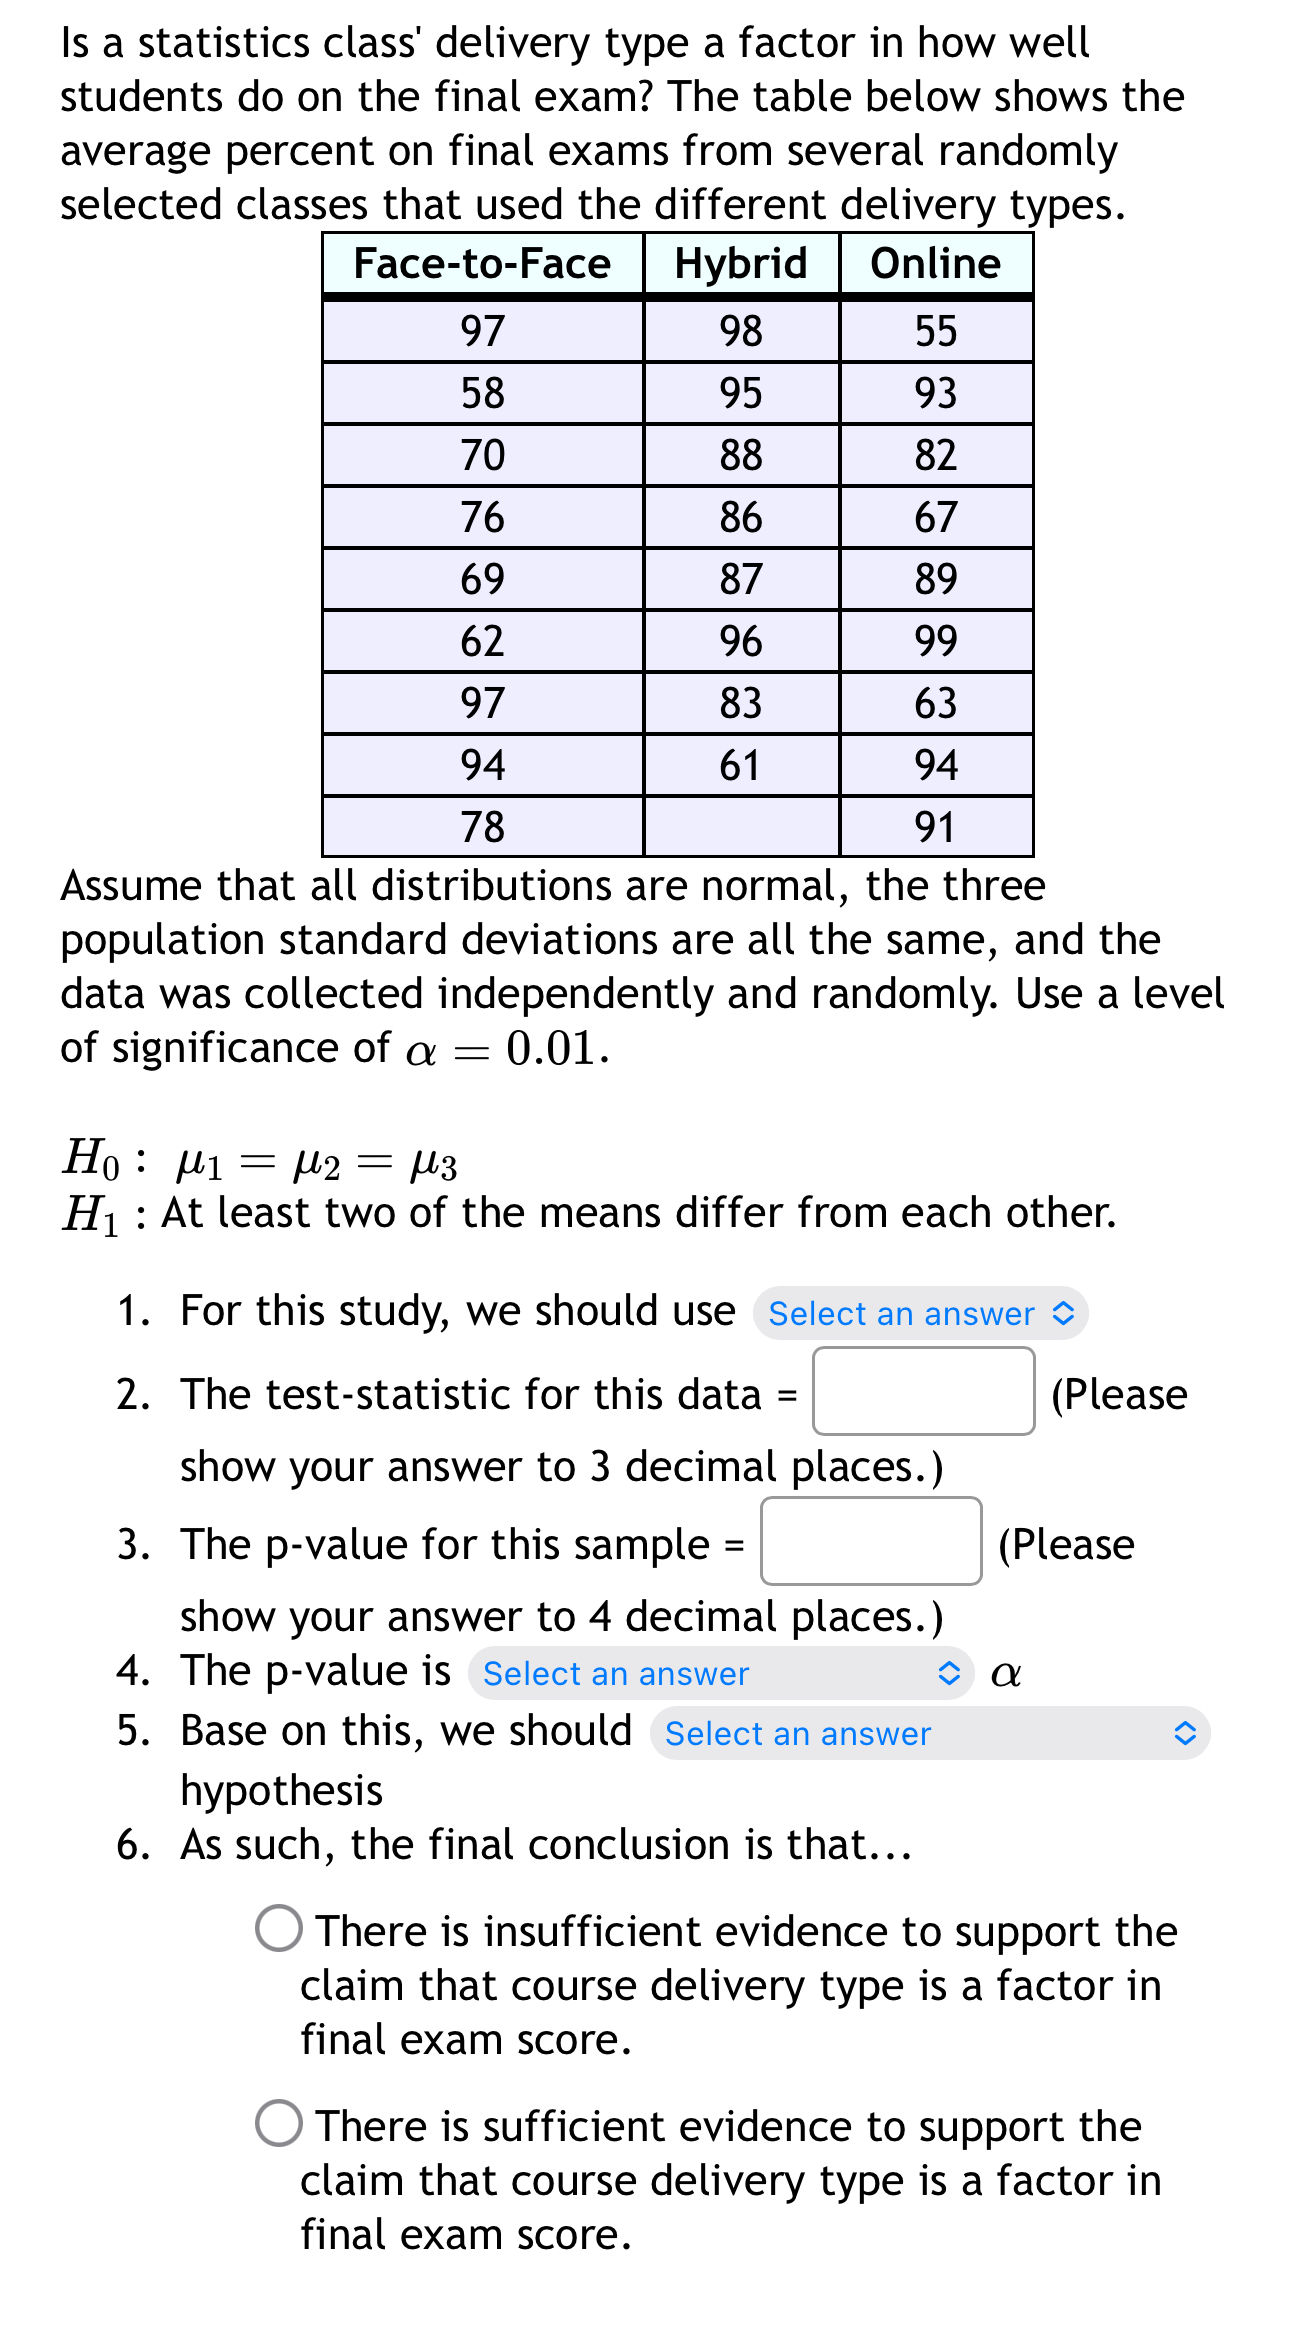
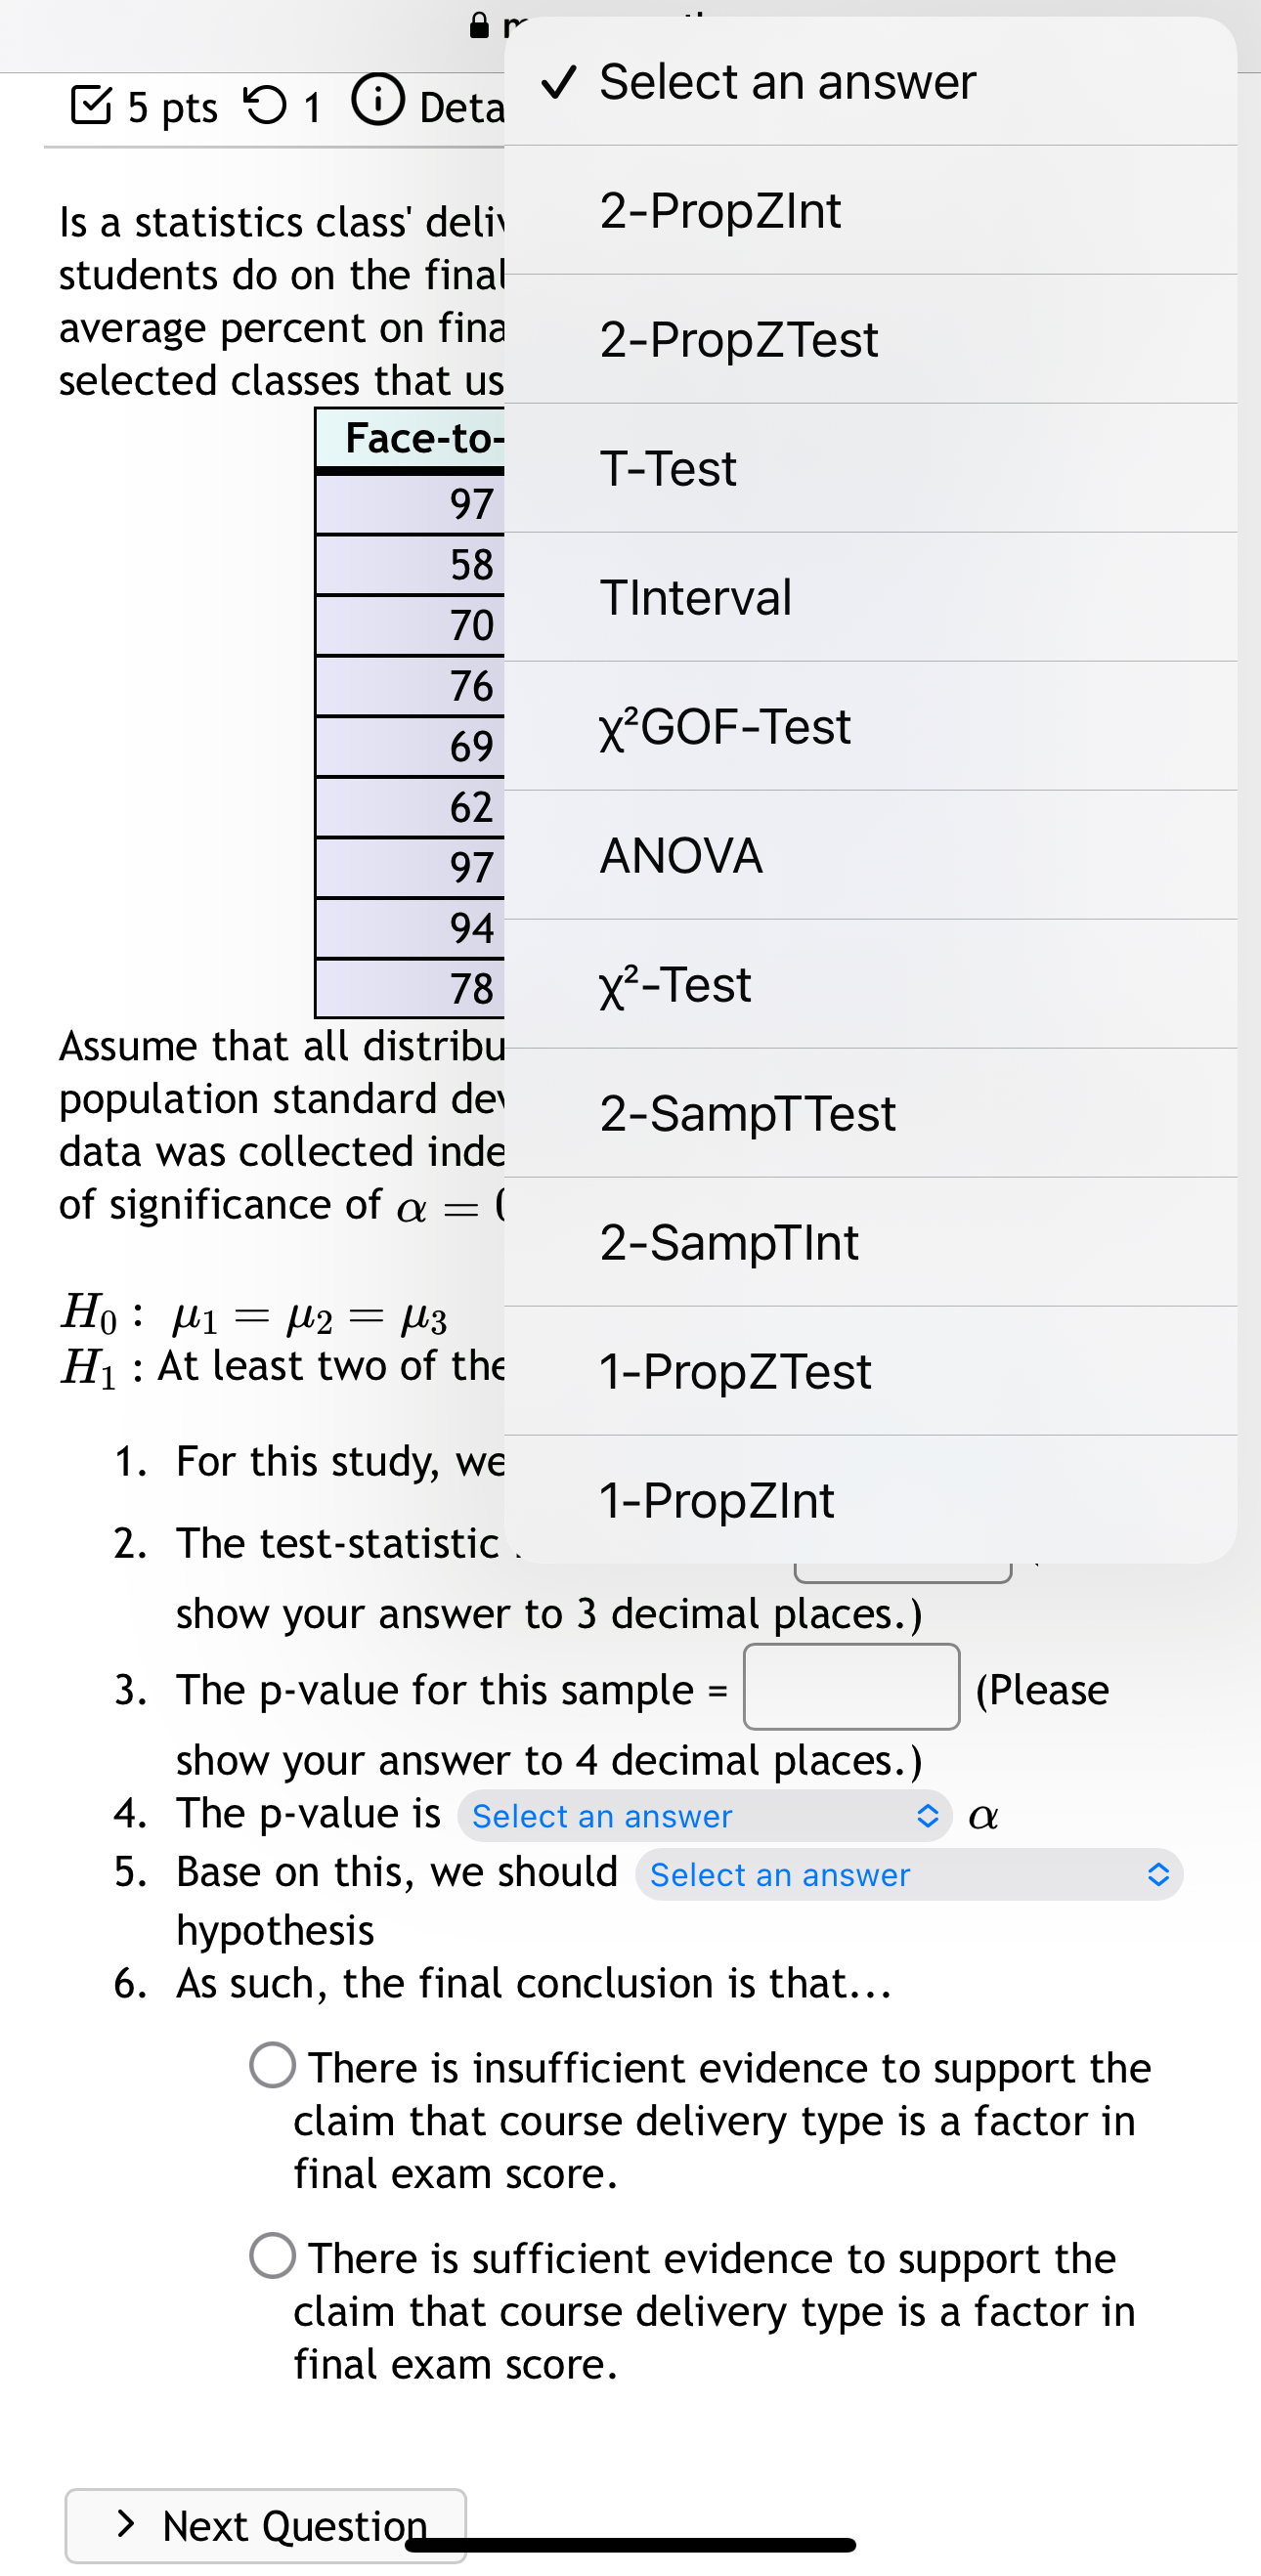
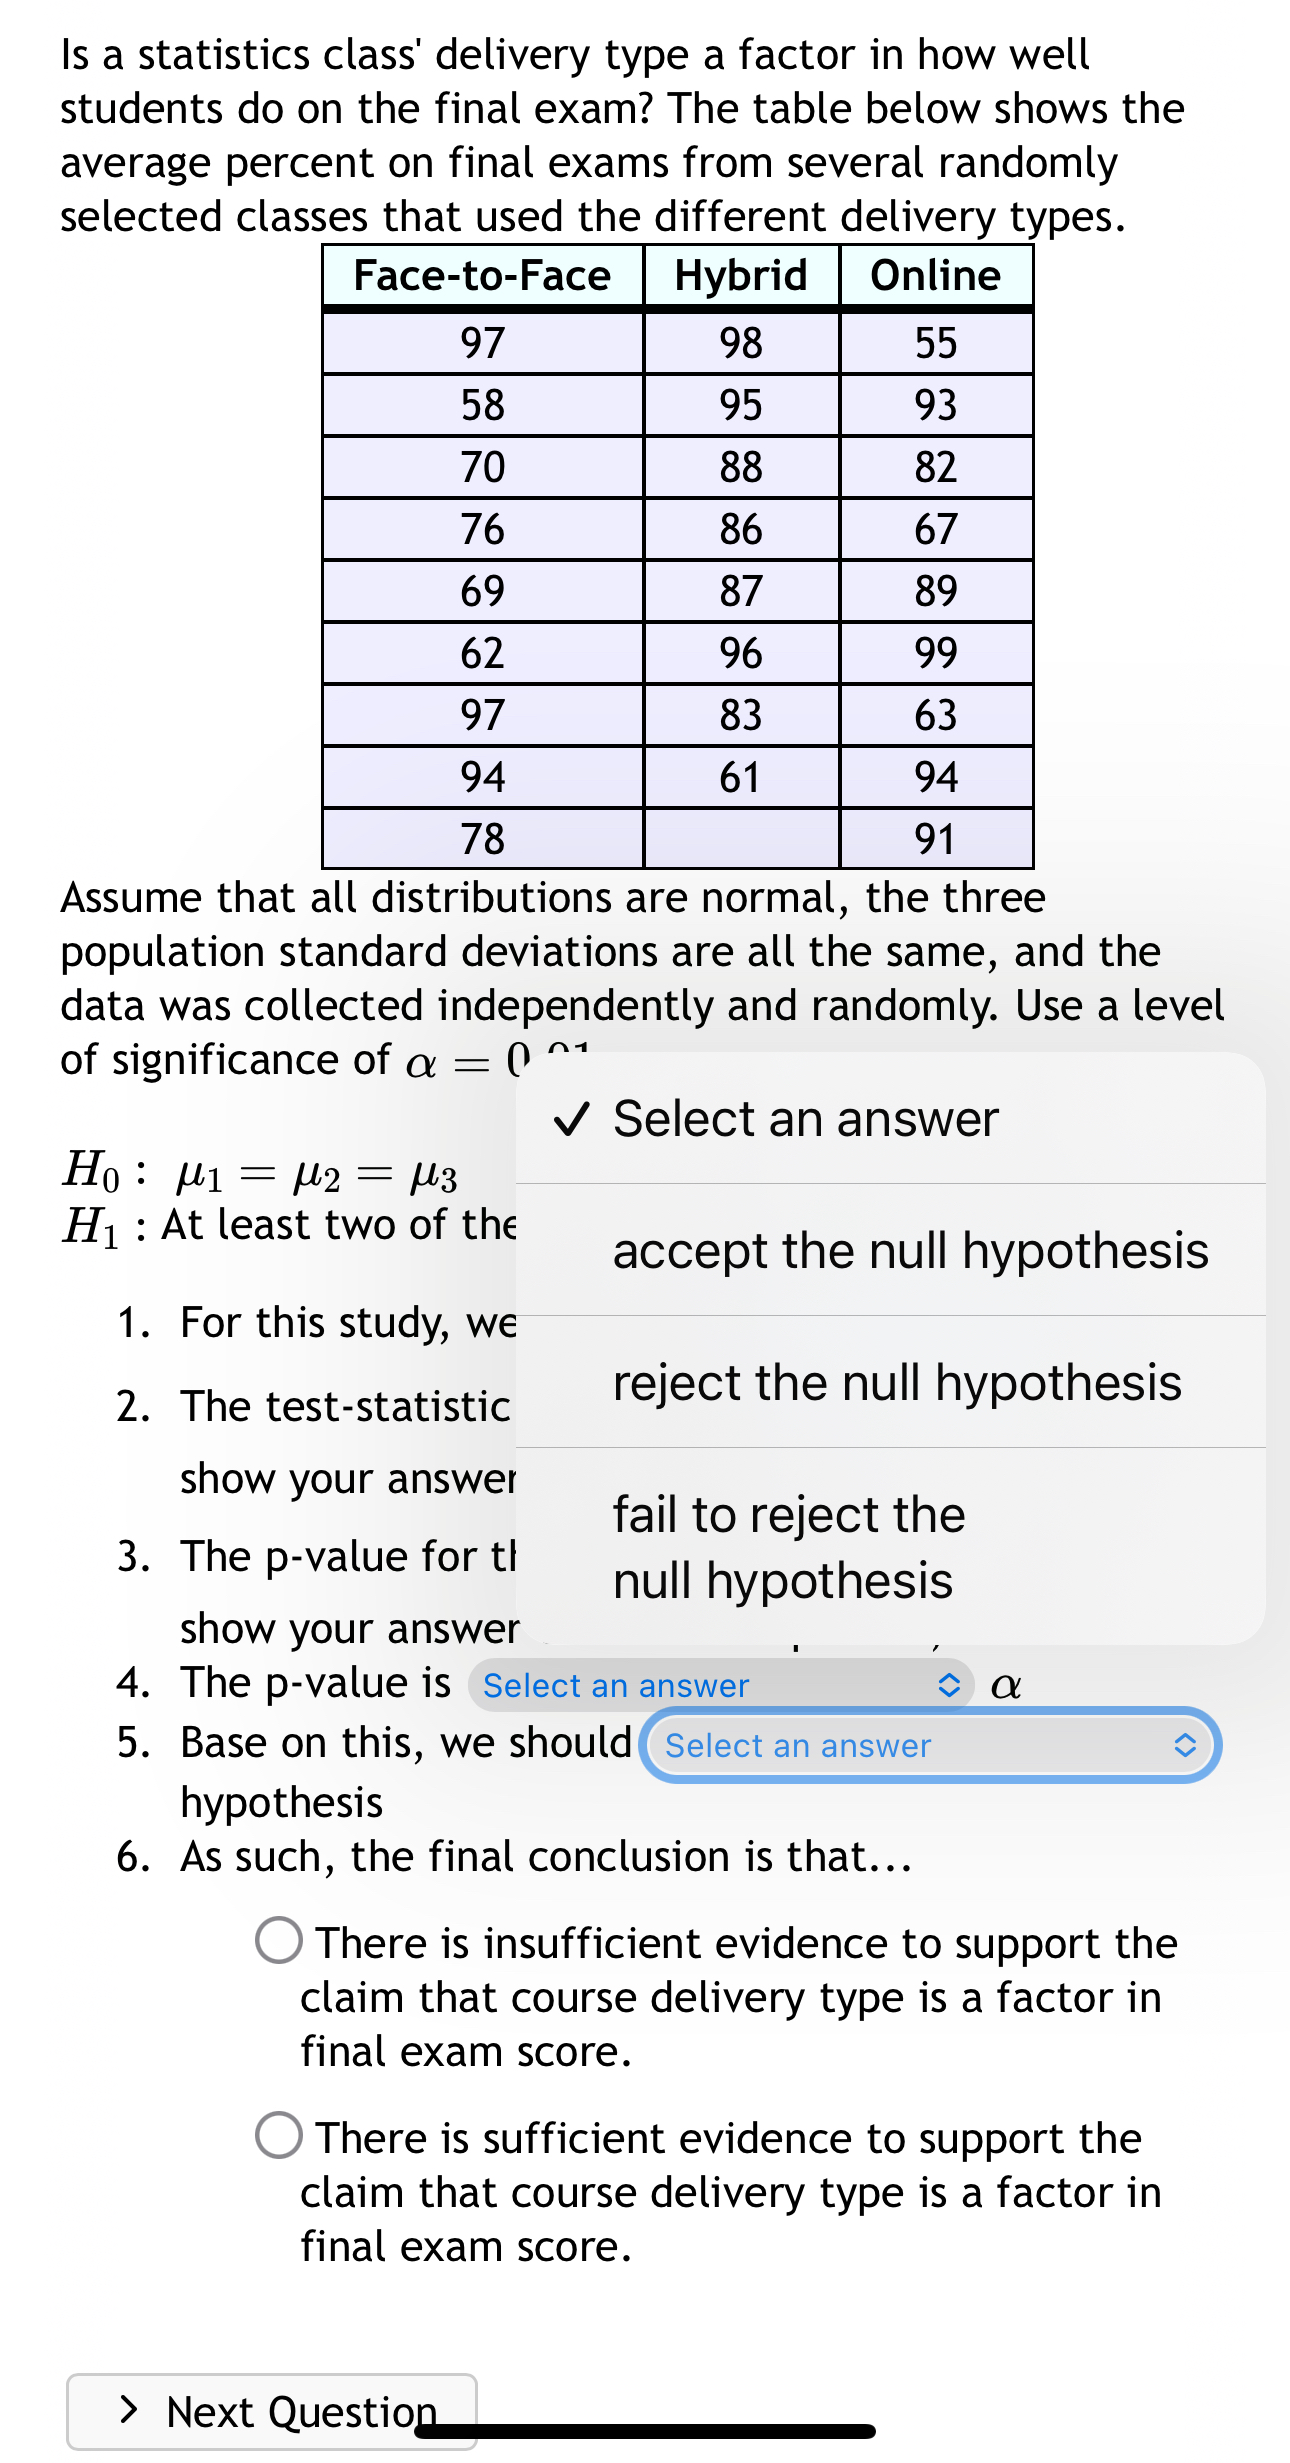
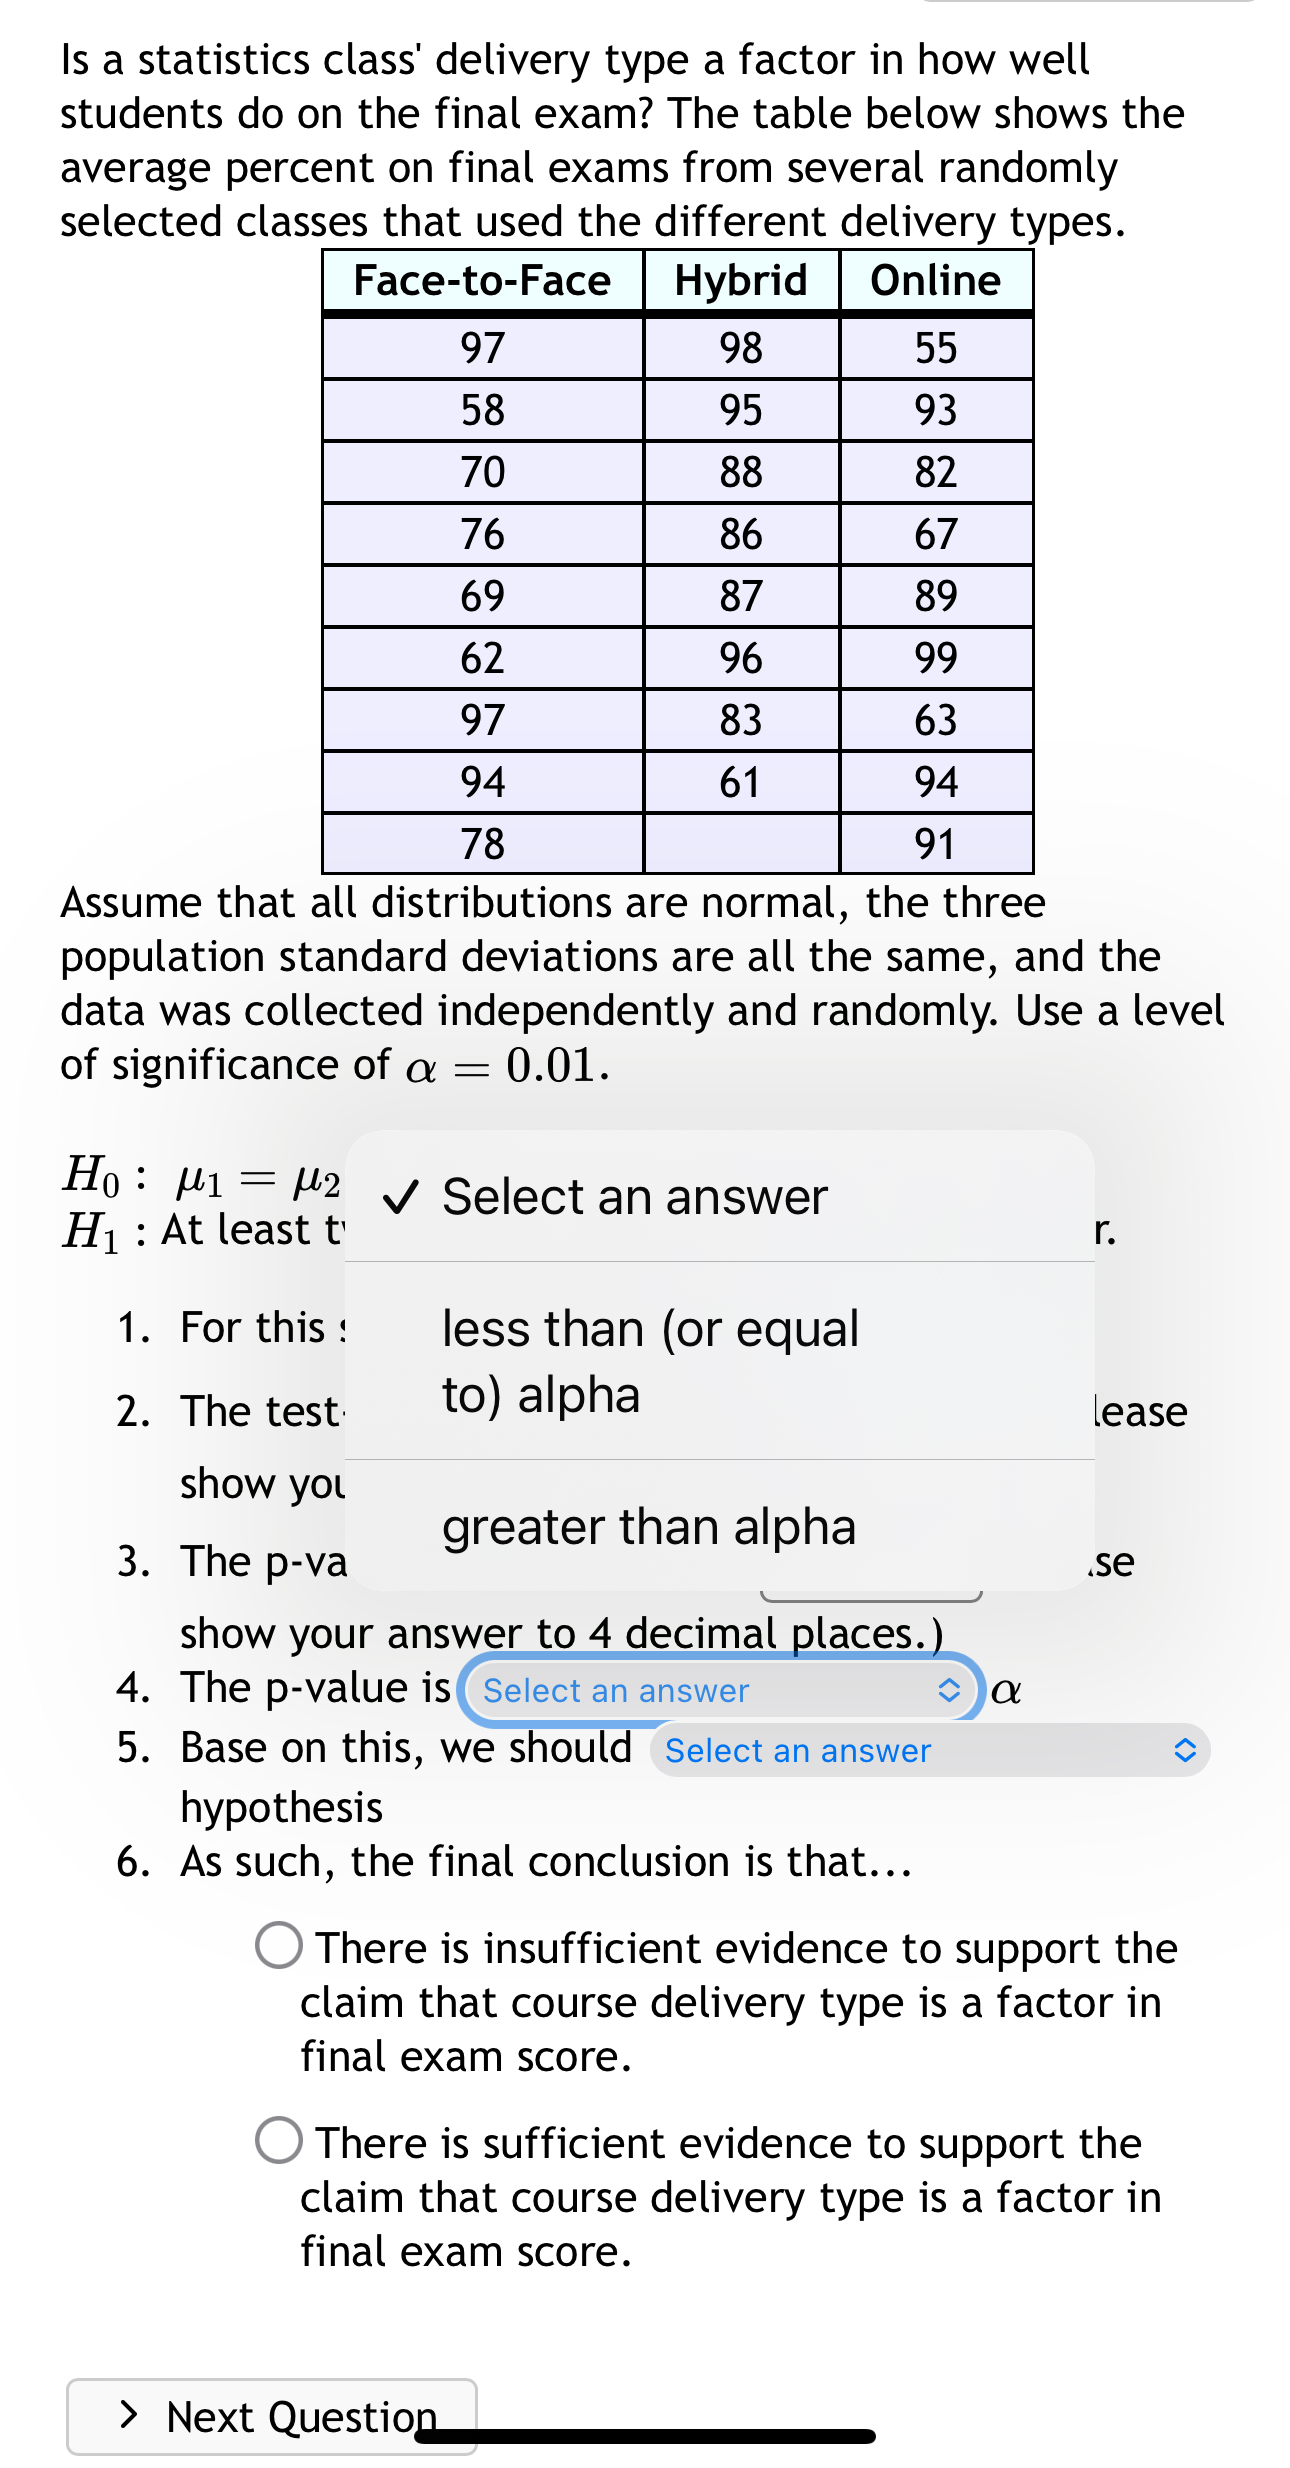
Is a statistics class' delivery type a factor in how well students do on the final exam? The table below shows the average percent on final exams from several randomly selected classes that used the different delivery types. Face-to-Face | Hybrid | Oniine Assume that all distributions are normal, the three population standard deviations are all the same, and the data was collected independently and randomly. Use a level of significance of o = 0.01. Hy: pp = p2 = ps3 H, : At least two of the means differ from each other. 1. For this study, we should use Select an answer 2. The test-statistic for this data = (Please show your answer to 3 decimal places.) 3. The p-value for this sample = (Please show your answer to 4 decimal places.) 4. The p-value is Select an answer T 5. Base on this, we should Select an answer hypothesis 6. As such, the final conclusion is that... O (U There is insufficient evidence to support the claim that course delivery type is a factor in final exam score. ) There is sufficient evidence to support the claim that course delivery type is a factor in final exam score. 5 pts 9 1 0 Deta V Select an answer Is a statistics class' deliv 2-PropZint students do on the final average percent on fina 2-PropZTest selected classes that us Face-to- T-Test 97 58 70 TInterval 76 69 x2GOF-Test 62 97 ANOVA 94 78 x2-Test Assume that all distribu population standard de 2-SampTTest data was collected inde of significance of a = ( 2-SampTint Ho : M1 = 12 = 13 H1 : At least two of the 1-PropZTest 1. For this study, we 1-PropZInt 2. The test-statistic . show your answer to 3 decimal places.) 3. The p-value for this sample = (Please show your answer to 4 decimal places.) 4. The p-value is Select an answer 5. Base on this, we should Select an answer C hypothesis 6. As such, the final conclusion is that... O There is insufficient evidence to support the claim that course delivery type is a factor in final exam score. O There is sufficient evidence to support the claim that course delivery type is a factor in final exam score. > Next QuestionIs a statistics class' delivery type a factor in how well students do on the final exam? The table below shows the average percent on final exams from several randomly selected classes that used the different delivery types. | Face-to-Face | Hybrid | Online | Assume that all distributions are normal, the three population standard deviations are all the same, and the data was collected independently and randomly. Use a level of significance of o = (* " v Select an answer Hy: p1=po = p3 H, : At least two of the accept the null hypothesis 1. For this study, we 2. The test-statistic reject the null hypothesis show your answel . . fail to reject the 3. The p-value for tl null hypothesis show your answer ) 4. The p-value is Select an answer c o 5. Base on this, we should( sclect an answer hypothesis 6. As such, the final conclusion is that... O () There is insufficient evidence to support the claim that course delivery type is a factor in final exam score. There is sufficient evidence to support the claim that course delivery type is a factor in final exam score. Is a statistics class' delivery type a factor in how well students do on the final exam? The table below shows the average percent on final exams from several randomly selected classes that used the different delivery types. Face-to-Face | Hybrid | Onine | Assume that all distributions are normal, the three population standard deviations are all the same, and the data was collected independently and randomly. Use a level of significance of o = 0.01. Ho: p1=p2 4 gelect an answer Hj : At least t r. 1. For this less than (or equal 2. The test to) alpha lease show you greater than alpha 3. The p-va se show your answer to 4 decimal places.) 4, The p-value is( Select an answer l 5. Base on this, we should select an answer
Step by Step Solution
There are 3 Steps involved in it

Get step-by-step solutions from verified subject matter experts