

Question: Is B the correct choice? Question 22 (1 point) Trend Analysis Plot for Womens Winning Time Linear Trend Model Yt = 11.835 - 0.06006xt 12.25
Is B the correct choice?
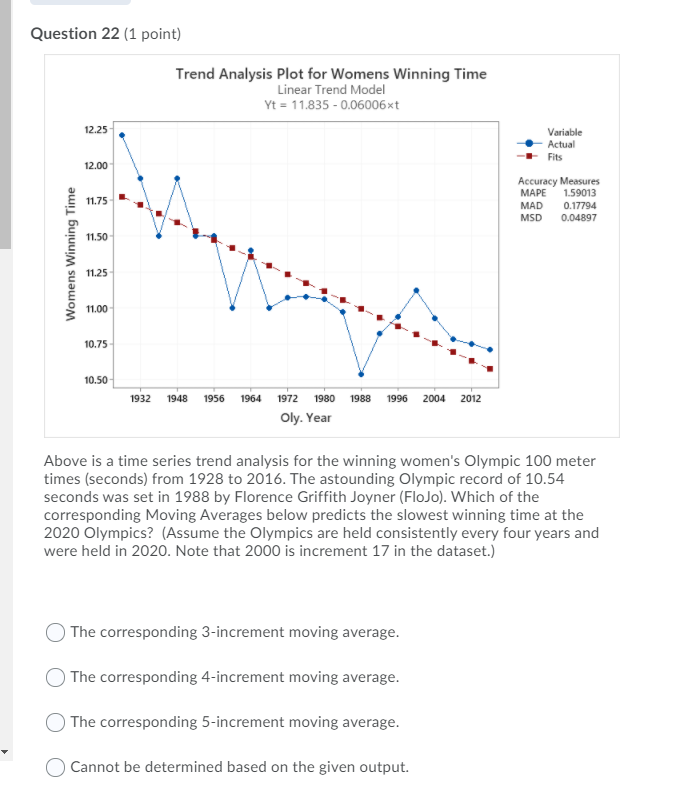
Question 22 (1 point) Trend Analysis Plot for Womens Winning Time Linear Trend Model Yt = 11.835 - 0.06006xt 12.25 Variable Actual Fits 12.00 Accuracy Measures MAPE 1.59013 11.75 MAD 0.17794 MSD 0.04897 11.50 Womens Winning Time 11.25 11.00 10.75 10.50 1932 1948 1956 1964 1972 1980 1988 1996 2004 2012 Oly. Year Above is a time series trend analysis for the winning women's Olympic 100 meter times (seconds) from 1928 to 2016. The astounding Olympic record of 10.54 seconds was set in 1988 by Florence Griffith Joyner (FloJo). Which of the corresponding Moving Averages below predicts the slowest winning time at the 2020 Olympics? (Assume the Olympics are held consistently every four years and were held in 2020. Note that 2000 is increment 17 in the dataset.) O The corresponding 3-increment moving average. The corresponding 4-increment moving average. The corresponding 5-increment moving average. O Cannot be determined based on the given output
Step by Step Solution
There are 3 Steps involved in it

Get step-by-step solutions from verified subject matter experts