

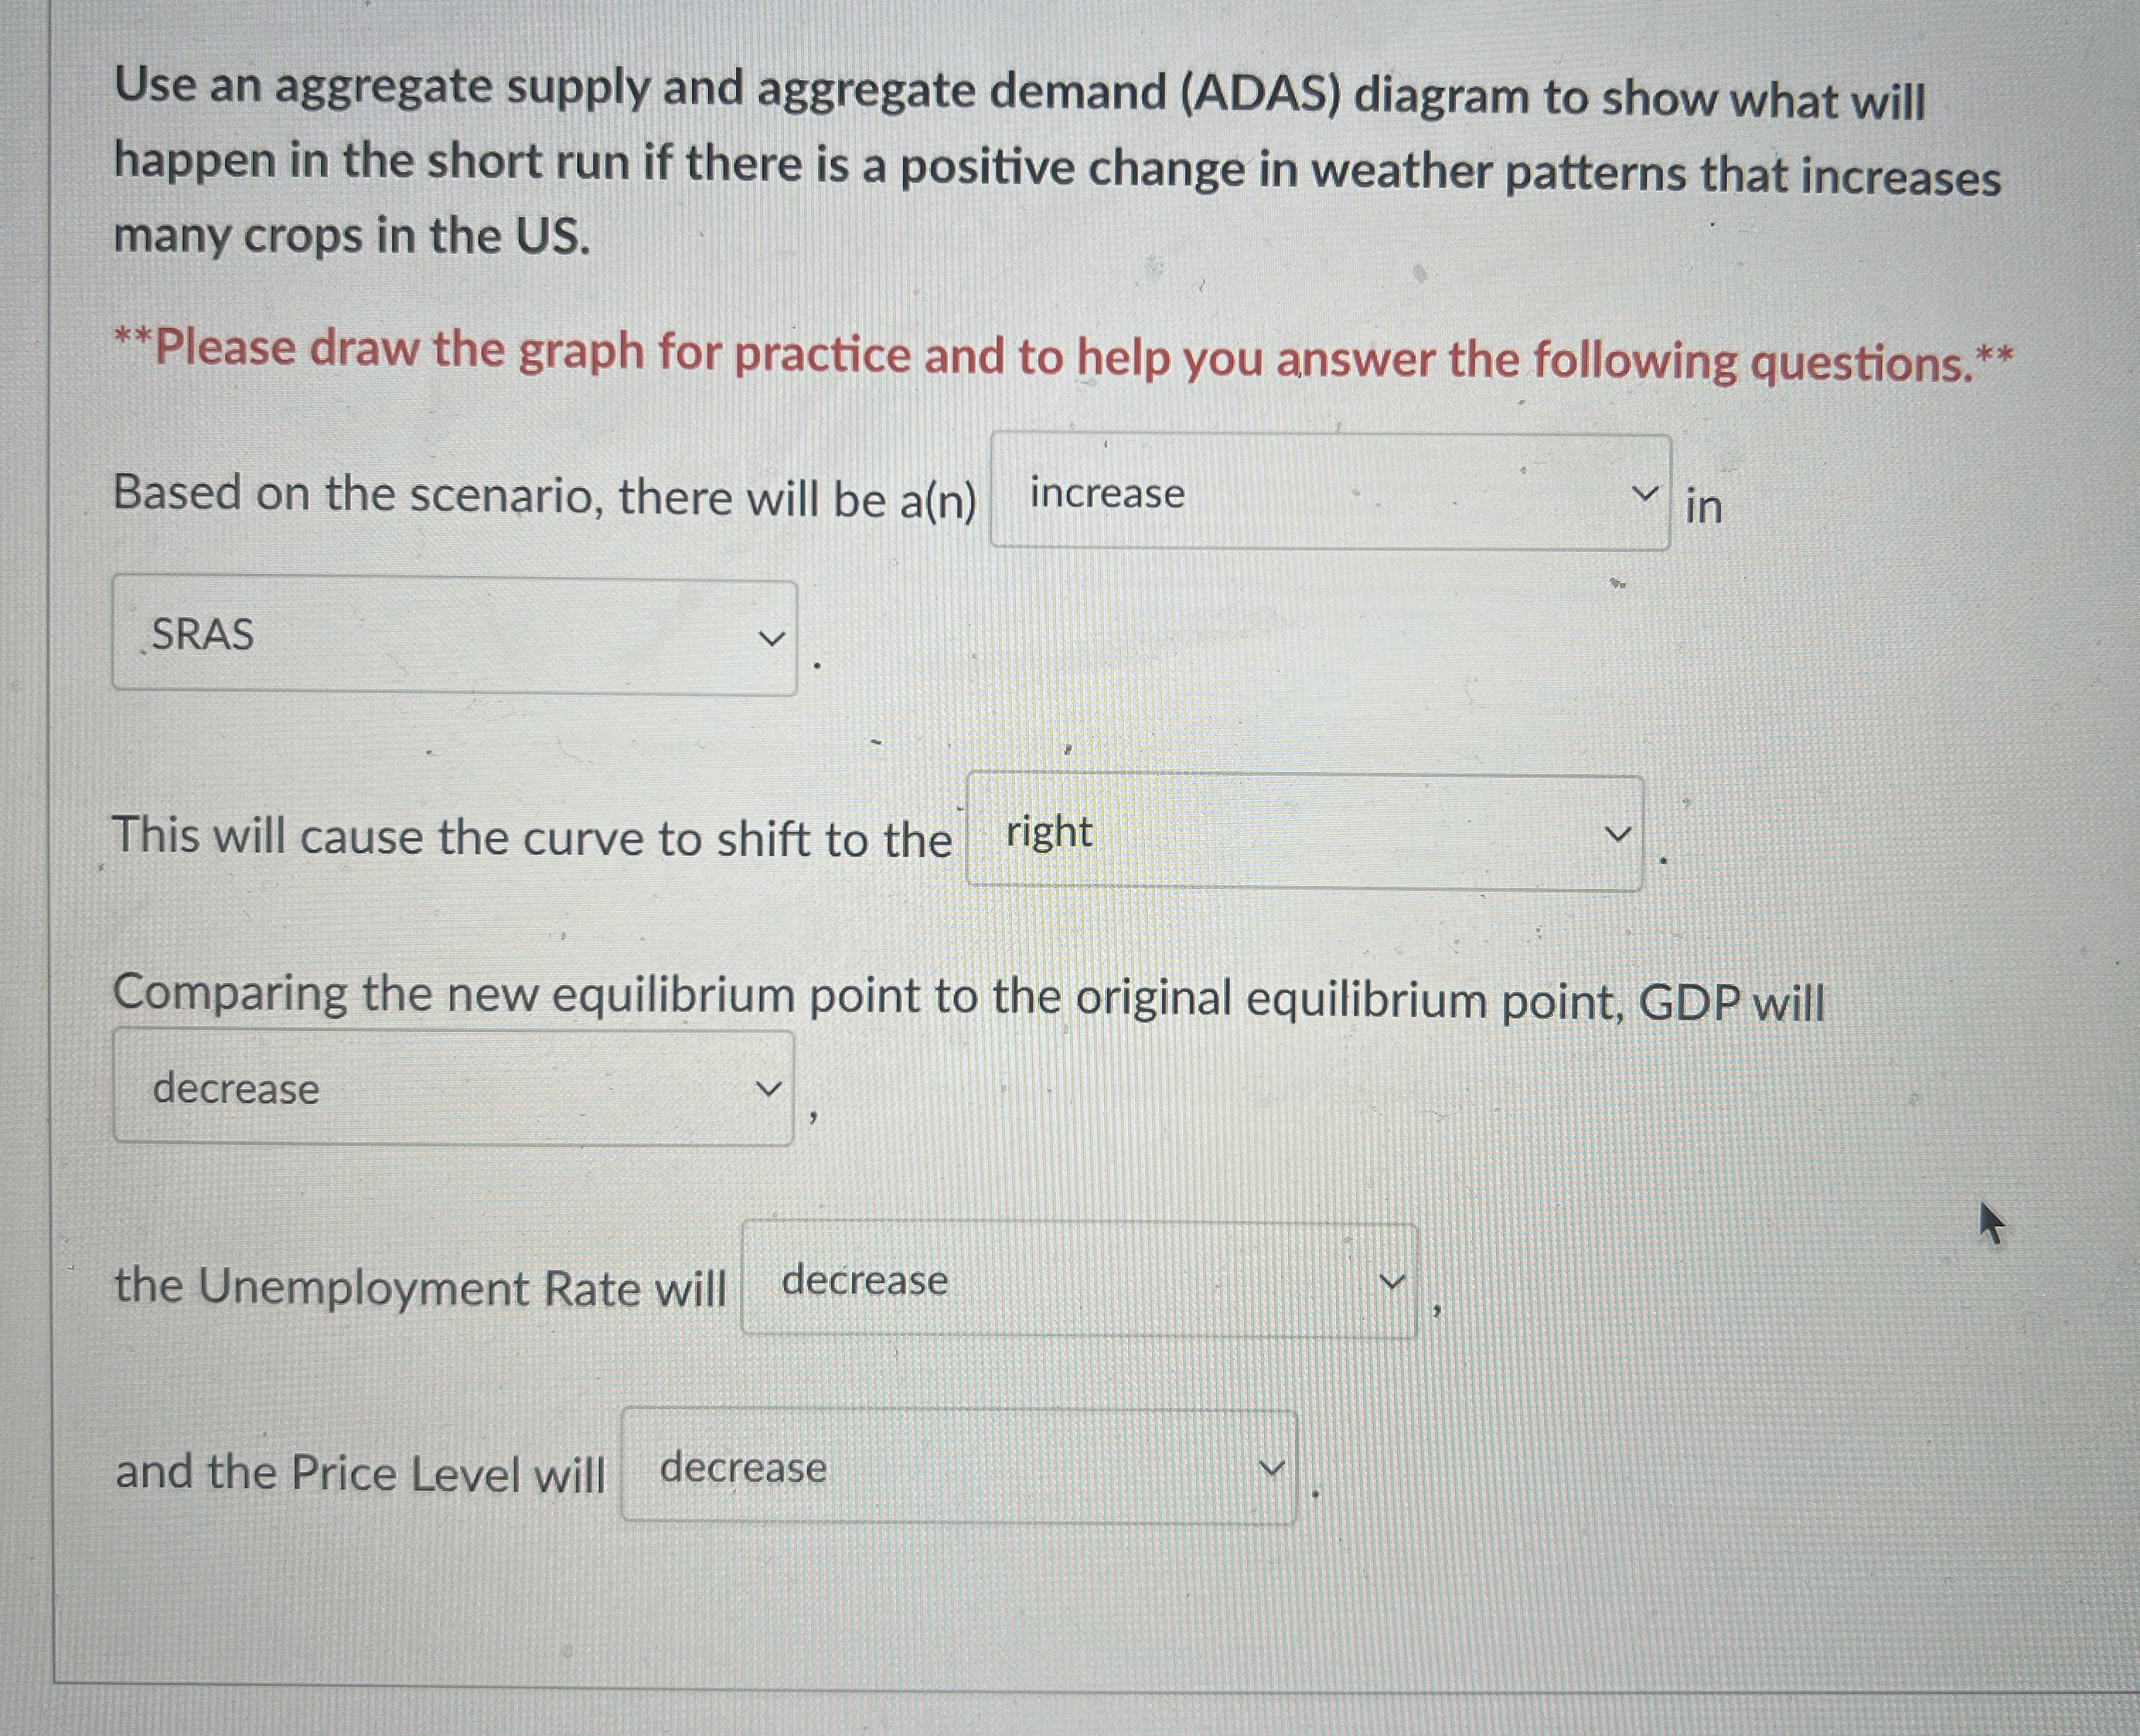
Question: Is my answer, attached in the image, correct for this question?: Use an aggregate supply and aggregate demand ( ADAS ) diagram to show what
Is my answer, attached in the image, correct for this question?: Use an aggregate supply and aggregate demand ADAS diagram to show what will happen in the short run if there is a positive change in weather patterns that increases many crops in the USPlease draw the graph for practice and to help you answer the following questions.Based on the scenario, there will be an Select from increase or decrease in Select from SRAS or AD This will cause the curve to shift to the Select from left or right Comparing the new equilibrium point to the original equilibrium point, GDP will Select from increase or decrease the Unemployment Rate will Select from increase or decrease and the Price Level will Select from increase or decrease
Step by Step Solution
There are 3 Steps involved in it
1 Expert Approved Answer
Step: 1 Unlock

Question Has Been Solved by an Expert!
Get step-by-step solutions from verified subject matter experts
Step: 2 Unlock
Step: 3 Unlock