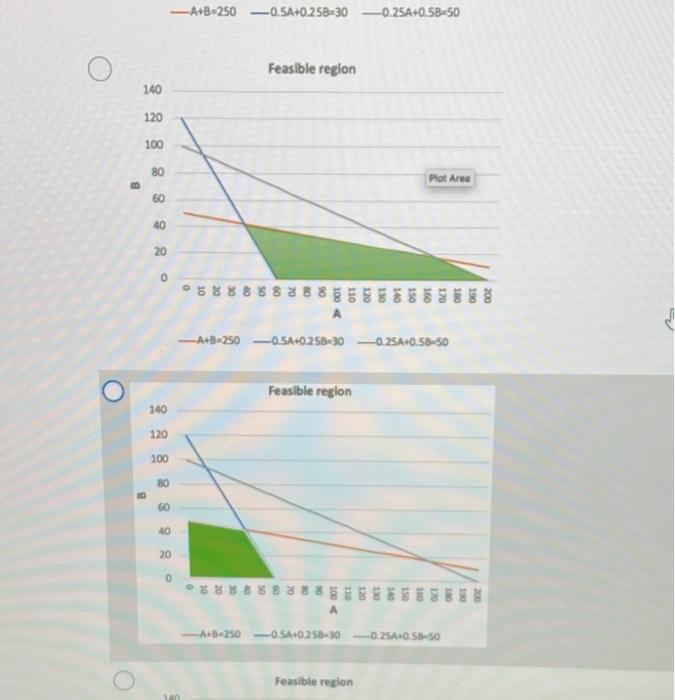
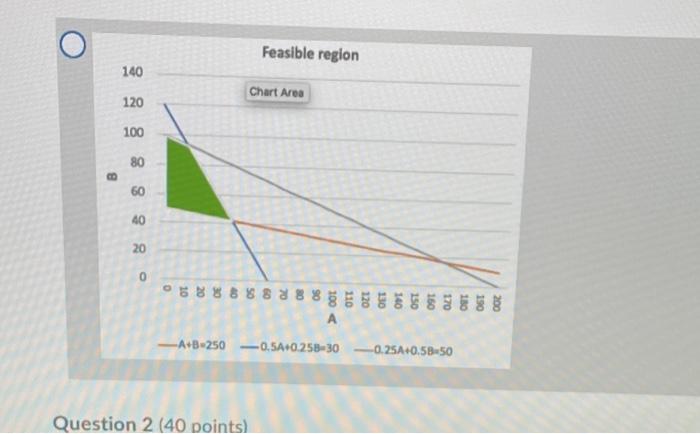
Question: is the answer graph 1, 2, 3 or 4? im kinda stuck on this question. Question 1 (20 points) Listen Identify the feasible region for

is the answer graph 1, 2, 3 or 4? im kinda stuck on this question. is the answer graph 1, 2, 3 or 4? im kinda stuck
is the answer graph 1, 2, 3 or 4? im kinda stuck
Question 1 (20 points) Listen Identify the feasible region for the following set of constraints. Which one is the correct feasible region? 0.5 A +0.25B > 30 A + 5B > 250 0.25A +0.5B 0 Feasible region 140 120 Plot Area 100 80 B 60 40 20 0 5% % 88 8883 A 120 130 240 150 160 A+B-250-0.5A+0.258-30 -0.25A+0.58.50 -A+B=250 -0.5A+0.258-30 -0.25A+0.53-50 Feasible region 140 120 100 80 Plot Area B 60 40 20 0 8 001 ont 120 DET 140 ISO -A+B-250 -0.5A+0.258-30-025A+0.58-50 Feasible region 140 120 100 BO GO 40 20 159 8888888 -A+B-250-SA+0.258-30 -0.25A-055-50 Feasible region Feasible region 140 Chart Area 120 100 80 60 40 20 0 8888888 06 110 120 100 C 10 140 150 -A-B-250 0,5A+0.258-30 -0.25A+0.58-50 Question 2 (40 points)

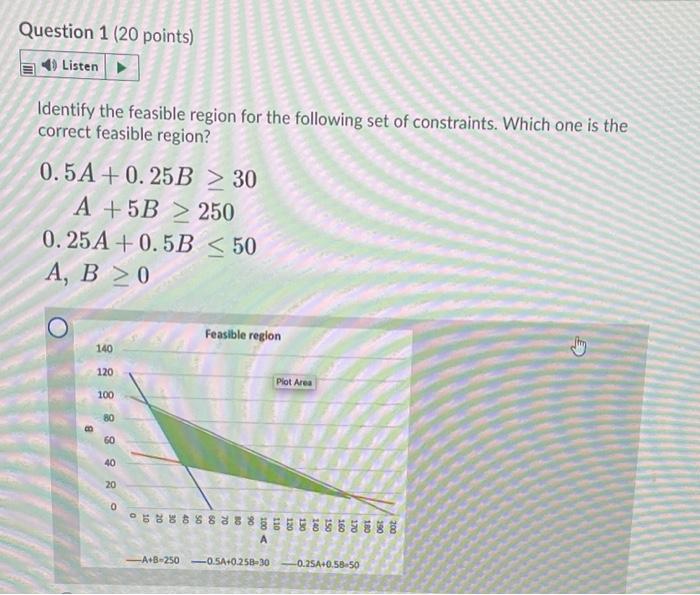
Step by Step Solution

There are 3 Steps involved in it

1 Expert Approved Answer
Step: 1 Unlock blur-text-image
Question Has Been Solved by an Expert!

Get step-by-step solutions from verified subject matter experts

Step: 2 Unlock
Step: 3 Unlock

Students Have Also Explored These Related General Management Questions!