

Question: Is this analysis correct. If yes, what is the break even point in the analysis? (1) (2) (3) (5) (7) (6) Units Average Average cost
Is this analysis correct. If yes, what is the break even point in the analysis? 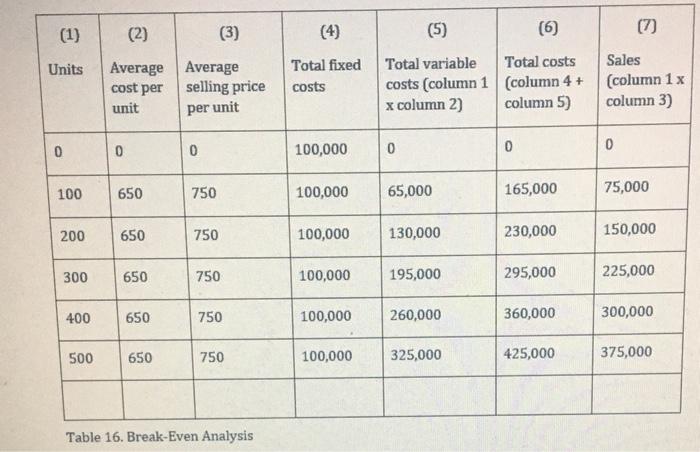
(1) (2) (3) (5) (7) (6) Units Average Average cost per selling price unit Total fixed costs Total variable Total costs costs (column 1 column 4 + x column 2) column 5) Sales (column 1 x column 3) per unit 0 0 0 100,000 0 0 0 100 650 750 100,000 65,000 165,000 75,000 200 650 750 100,000 130,000 230,000 150,000 300 650 750 100,000 195,000 295,000 225,000 400 650 750 100,000 260,000 360,000 300,000 500 650 750 100,000 325,000 425,000 375,000 Table 16. Break-Even Analysis
Step by Step Solution
There are 3 Steps involved in it
1 Expert Approved Answer
Step: 1 Unlock

Question Has Been Solved by an Expert!
Get step-by-step solutions from verified subject matter experts
Step: 2 Unlock
Step: 3 Unlock