

Question: Is this correct? a. Analyze the relationship between BMI category and diastolic blood pressure. [3 points] Present the statistical output (from StatCrunch) summarizing the relationship
Is this correct?
a. Analyze the relationship between BMI category and diastolic blood pressure. [3 points]
Present the statistical output (from StatCrunch) summarizing the relationship between diastolic blood pressure of participants by BMI category.
This data has been reached using the five number summary produced by StatCrunch to identify the relationship between BMI category and diastolic blood pressure. When evaluated it is shown that BMI category is a significant predictor of high diastolic BP. Participants of normal weight were less likely to have high diastolic BP than those who were in overweight category.
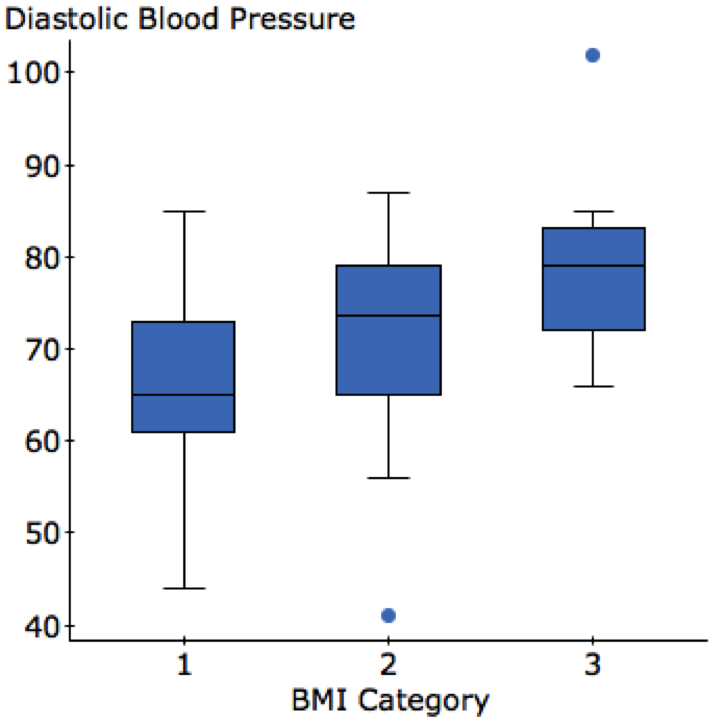
Outliers: In this dataset there are two suspected outliers. The max diastolic BP for those in the obese category is 102, which is considered a suspected outlier using the 1.5(IQR) criterion (83+1.5(11)=99.5). The minimum diastolic BP for those in the overweight BMI category is 41, which is also considered a suspected outlier using the 1.5(IQR) criterion (65-1.5(14)=44). Those considered of normal do not have any suspected outliers.
Center: The median diastolic blood pressure in those of normal BMI (65) is less than the median of the other two distributions overweight (73.5) and obese (79).
Spread: The obese BMI category has the smallest variation in diastolic BP (range=36, IQR= 11) 50% range from 72 mmHg to 83 mmHg. Larger variation in diastolic blood pressure are found in those with normal BMI (range=41, IQR=12) where 50% of participants range from 61 mmHg to 73 mmHg. Those in the overweight (range= 46, IQR=14) BMI categories where 50% range from 65 mmHg to 83 mmHg.
This summary also provides the distribution of subjects in the different categories of BMI and Diastolic BP. Maximum numbers of participants were in the normal BMI category (46.25%) followed by those in overweight category (37.5%). The lowest number of participants were found in the obese category (16.25%).
b. Include graphical presentation of this relationship.
c. Describe the graph from 5b.
By examining the three side-by-side boxplots and the numerical summaries, we see at once that BMI category obese, as a group has a higher diastolic blood pressure than those considered normal and overweight.
![blood pressure. [3 points]Present the statistical output (from StatCrunch) summarizing the relationship](https://dsd5zvtm8ll6.cloudfront.net/si.experts.images/questions/2024/10/6703ed64ae56b_6286703ed649a765.jpg)
\fSummary statistics for dias: Group by: BMIcat BMIcato no Meant Variances Std. demo Std. errJ Medians Range: Min. Max. Q1: Q3. 1 37 66.837838 105.91742 10.291619 1.6919317 65 41 44 85 61 73 2 30 71.133333 102.6023 10.129279 1.8493449 73.5 46 41 87 65 79 3 13 78.384615 91.25641 9.5528221 2.6494761 79 36 66 102 72 83
Step by Step Solution
There are 3 Steps involved in it

Get step-by-step solutions from verified subject matter experts