

Question: IS1 7.3 Interactive Assignment X * Course Hero X IS) Dashboard X IS) Chapter 6 Quiz X + X usaonline.southalabama.edu/courses/33021/assignments/475204 . . . was Deep

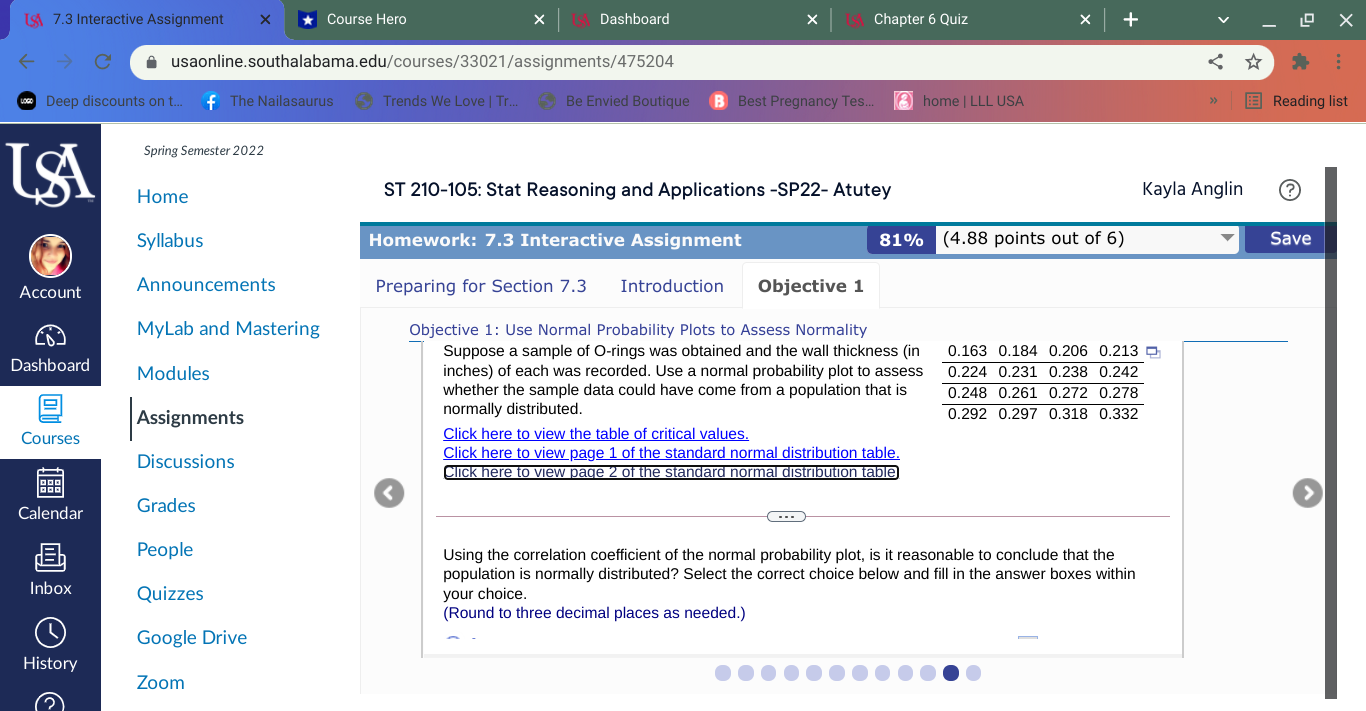
IS1 7.3 Interactive Assignment X * Course Hero X IS) Dashboard X IS) Chapter 6 Quiz X + X usaonline.southalabama.edu/courses/33021/assignments/475204 . . . was Deep discounts on t.. f The Nailasaurus ) Trends We Love | Tr... ) Be Envied Boutique B Best Pregnancy Tes.. home | LLL USA Reading list Spring Semester 2022 Home ST 210-105: Stat Reasoning and Applications -SP22- Atutey Kayla Anglin (? Syllabus Homework: 7.3 Interactive Assignment 81% (4.88 points out of 6) Save Account Announcements Preparing for Section 7.3 Introduction Objective 1 MyLab and Mastering Objective 1: Use Normal Probability Plots to Assess Normality Suppose a sample of O-rings was obtained and the wall thickness (in 0.163 0.184 0.206 0.213 Dashboard Modules inches) of each was recorded. Use a normal probability plot to assess 0.224 0.231 0.238 0.242 whether the sample data could have come from a population that is 0.248 0.261 0.272 0.278 2 Assignments normally distributed. 0.292 0.297 0.318 0.332 Courses Click here to view the table of critical values. Discussions Click here to view page 1 of the standard normal distribution table. Click here to view page 2 of the standard normal distribution table Calendar Grades Eh People Using the correlation coefficient of the normal probability plot, is it reasonable to conclude that the population is normally distributed? Select the correct choice below and fill in the answer boxes within Inbox Quizzes your choice. (Round to three decimal places as needed.) Google Drive History Zoom
Step by Step Solution
There are 3 Steps involved in it

Get step-by-step solutions from verified subject matter experts