

Question: ISO 2E402 1 2 3 4 5 6 7 8 2E07 USO H2 USD A B D Global Compan Data Data Year - Industry Ticker
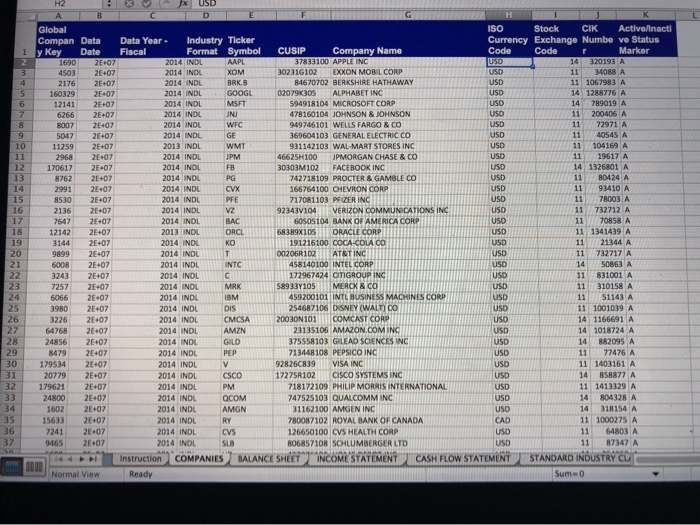
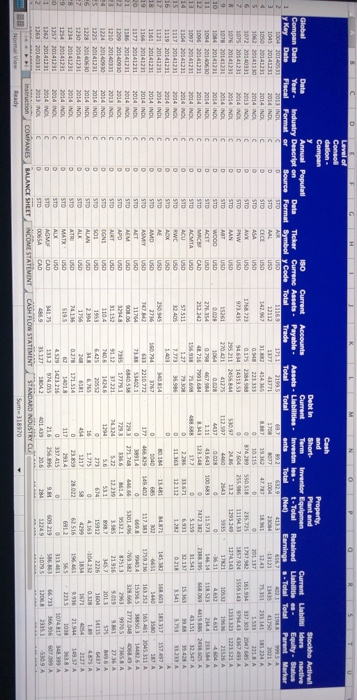
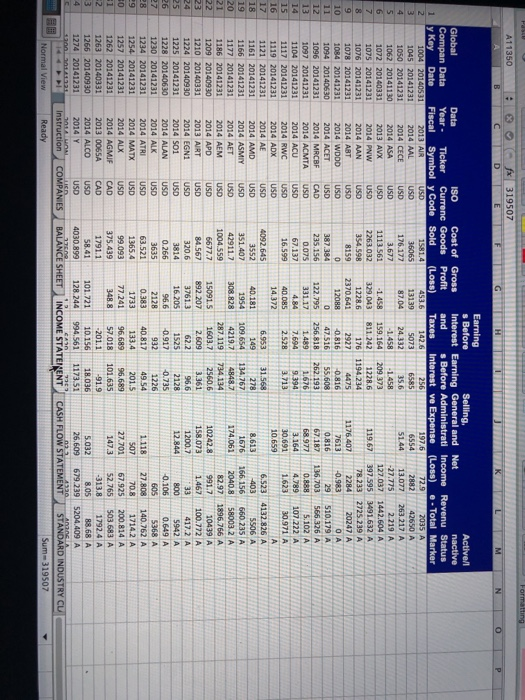
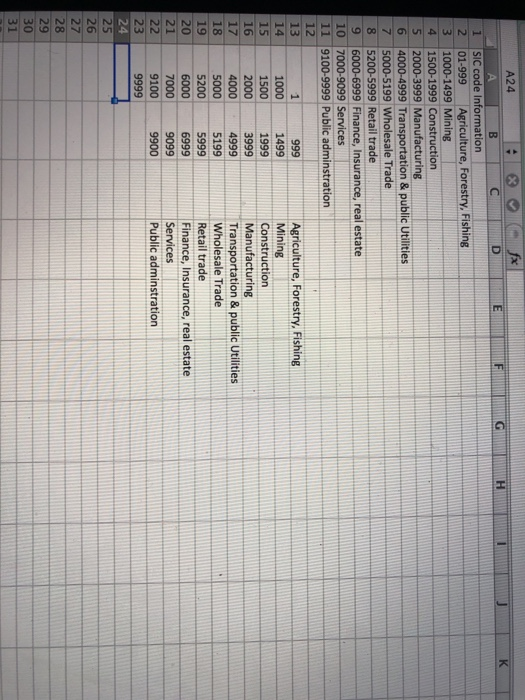
ISO 2E402 1 2 3 4 5 6 7 8 2E07 USO H2 USD A B D Global Compan Data Data Year - Industry Ticker y Key Date Fiscal Format Symbol 1690 2E+07 2014 INDL AAPE 4503 2014 INDL XOM 2176 2E07 2014 INDL BRKB 160329 2E+07 2014 INDL GOOGL 12141 2E+07 2014 INDL MSFT 6266 2E+07 2014 INDL JNJ 8007 2E07 2014 INDE WEC 5047 2E407 2014 INDL GE 11259 2E07 2013 INDL WMT 2968 2E+07 2014 INDL JPM 170617 2E+07 2014 INDL FB 8762 2E+07 2014 INDL PG 2991 2E+02 2014 INDL CVX 8530 2014 INDL PFE 2136 2E07 2014 INDL VZ 7647 2E07 2014 INDL BAC 12142 2E+07 2013 INDL ORCL 3144 2E407 2014 INDL 9899 2E407 2014 INDL T 6008 2E07 2014 INDL INTC 3243 2E+07 2014 INDL C 7257 2E+07 2014 INOL MRK 6066 2E+07 2014 INDI IBM 3980 2E07 2014 INDL DIS 3226 2E407 2014 INDL CMCSA 64768 2E+07 2014 INDL AMZN 24856 2E+07 2014 INDL GILD 8479 2E+07 2014 INDL PEP 179534 2E07 2014 INDL V 20779 2E+07 2014 INDL CSCO 179621 2E+07 2014 INDL PM 24800 2E407 2014 INDL QCOM 1602 2E+07 2014 INDL AMGN 15633 2E07 2014 INDL RY 7241 2E407 2014 INDL CVS 9465 2E+07 2014 INDL SLB Instruction Normal View Ready 10 11 12 13 14 15 16 17 18 19 20 21 22 23 24 25 26 27 28 29 30 31 32 33 34 35 36 37 G H Stock CIK Active/Inacti Currency Exchange Numbe ve Status CUSIP Company Name Code Code r Marker 37833100 APPLE INC USD 14 320193 A 302316102 EXXON MOBIL CORP USD 11 34088 A 84670702 BERKSHIRE HATHAWAY USD 11 1067983 A 02079305 ALPHABET INC USD 14 1288776 A 594918104 MICROSOFT CORP USD 14 789019 A 478160104 JOHNSON & JOHNSON USD 11 200406 A 949746101 WELLS FARGO & CO USD 11 72971 A 369604103 GENERAL ELECTRIC CO USD 11 40545 A 931142103 WAL-MART STORES INC USD 11 104169 A 46625H100 JPMORGAN CHASE & CO USD 11 19617 A 30303M102 FACEBOOK INC USD 14 1326801 A 742718109 PROCTER & GAMBLE CO USD 11 80424 A 166764100 CHEVRON CORP USD 11 93410 A 717081103 PFIZER INC USD 11 78003 A 92343V104 VERIZON COMMUNICATIONS INC USD 11 732712 A GOSOS104 BANK OF AMERICA CORP 11 70858 A 68389x105 ORACLE CORP USD 11 1341439 A 191215100 COCA-COLA CO 11 21344 A 00206R102 ATATING USD 11 732717 A 458140100 INTEL CORP USD 14 50863 A 172967424 OTGROUPING USD 11 831001 A 58933Y105 MERCK & CO USD 11 310158 A 459200101 INTL BUSINESS MACHINES CORP USD 11 51143 A 254687106 DISNEY (WALTICO USD 11 1001039 A 20030N101 COMCAST CORP USD 14 1166691 A 23135106 AMAZON.COM INC USD 14 1018724 A 375558103 GILEAD SCENCES INC USD 14 882095 A 713448108 PEPSICO INC USD 11 77476 A 928260839 VISA INC USD 11 1403161 A 17275R102 CISCO SYSTEMS INC USD 14 858877 A 718172109 PHILIP MORRIS INTERNATIONAL USD 11 1413329 A 747525103 QUALCOMM INC USD 14 804328 A 31162100 AMGEN INC USD 14 318154 A 780087102 ROYAL BANK OF CANADA CAD 11 1000275 A 126650100 CVS HEALTH CORP USD 11 64803 A 806857108 SCHLUMBERGER LTD USD 11 87347 A ANI INCOME STATEMENT CASH FLOW STATEMENT STANDARD INDUSTRY CU Sumo USD COMPANIES BALANCE SHEET O ents > 0115 o 201157 2013 108 2014 2014 9 10 . B D K. Lo Consol dation Compan Cash and Property Global Data Debt in Annual Populati Short- ISO Current Accounts Plant and Compan Data Current Year Stockho Active Term Industry Descripton Data Ticker Inventor Equipmen Currene Assets Payable - Current Liabili ders y Key active Date Fiscal Formator Assets - Liabilities. Investm les. Source Format Symbol y Code Total t-Total Retained Liabilities Trade 2013 INDE Total Equity - Status Total AR Earnings - Total Total Total USD Parent Marker 1045 20141233 2014 INDL C c. D 892 STO AAL USD 2016 20141231 c INDE STO 2007 1004 CECE USD 142.357 454.365 2003 20041130 STO 2014 18.12 213141 181234 1072 20140331 c. STE USO 02 16 3075 20141231 2014 18 C STO PAW 9 US SSOS 92345 1972 235.25 1615 9476341431353 1096 20161231 337.303 2047685 760 2016 NOU D STO 1551 MAN 1119 USD 9857934 M 295 211 456.844 C D STO ANT 1295.24 12741 11222521 A US 2003 4125 2034 INDU 1034 20141231 C . D 1127 DOOR 19 U 1094 20140610 17 2014 NO STD A 27150 an 1096 20141211 0790 467 1.11 100.689 C 146.14 STO CAD 25330 4.736 7.64 3097 20141211 2014 NO 123.148 7472.18 C 281 S. M. 2005 A STD 7. UD 110420161211 5.159 C STO ACU USO 13671 our 6931 32.137 STO WWE 1119 2014123 12113 0218 1212 3541 1844 2016 NOL 0 .. 2014 INDL 3 MO814 1163 20141231 s 2014 INDL S60 183117 1537 AVO 0 665 685 1166 20141231 2014 IND TA 540 350 6132280.772 172 1753236 163 1177 20141231 599 2014 MT 165.461 2045311 A URD 11764 0 434 116 20141211 1556 358503 1436 C 1.209 2014093 793 TL 328666 7728 13 C APO 2395 177791 1250 2014 1634 SA 82513 2013 NOL 33 AIRT C D 31153 37.231 12 21916 9.019 2 1224 2014090 2054 INDL C 4721 110 4 O SB 531 BA 122520141231 2014 INDI C STO 155 w 305 273 15812 1228 20160630 2014 INDL 54115 ALAN C 16 2.394 mu 1. 4163 1230 20141211 4.75 A 2014 INDE c ALE STO 20 6151 1217 2009 16 4299 ST 123420341231 AT 2127 A 1671 2014 74196 . 171 514 2802 195 149.5 1254 2014121 c 2014 NO 21.544 STO MATX USD wa 14013 117 465 1757 20141251 1038 3638 2014 INOL C D STO AUX USD 459 1402256 337415 31461 D 2014 NOE 3439 A STO AGMUP CAD 341.25 NOSS 603219 58663 366.556 1263 20160831 2013 NOL D STO CAD 4869 1043 -1079 23351 COMPANIES BALANCE SHEET INCOME STATEMENT CASH FLOW STATEMENT STANDARD INDUSTRY CU Now Ready Sum 318970 12 13 14 15 16 17 18 19 0 ws PECE 7341 O TOES 21 6840538 THE RE go . non 25 26 27 SCT BRE 0 0 > 0 O O 1 non VIA PS Formatting A11350 fx 319507 d H M N 1 2 3 4 5 6 7 8 9 10 11 12 13 14 15 16 17 18 19 USD Earning s Before Selling, Active/ Global Data ISO Cost of Gross Interest Earning General and Net nactive Compan Data Year - Ticker Currenc Goods Profit and s Before Administrati Income Revenu Status y Key Date Fiscal Symbol y Code Sold (Loss) Taxes Interest ve Expense (Loss) e - Total Marker 1004 20140531 2013 AIR USD 1581.4 453.6 142.6 256 1976 72.9 2035 A 1045 20141231 2014 AAL USO 35065 13139 5073 6585 6554 2882 42650 A 1050 20141231 2014 CECE USD 176.177 87.04 24.332 35.6 51.44 13.077 263.217 A 1062 20141130 2014 ASA USD 3.677 -1.458 -1.458 -27.775 2.219 A 1072 20140331 2013 AVX USD 1113 561 -1.458 159.164 209.373 127.037 1442.604 A 1075 20141231 2014 PNW USD 2263.032 329,043 811.242 1228.6 119.67 397.595 3491.632 A 1076 20141231 2014 AAN USD 354.598 1228.6 176 1194.234 78.233 2725.239 A 1078 20141231 2014 ABT USD 8159 2370.641 2927 4475 1176.407 2284 20247 A 1084 20141231 2014 WDDD USD 0 12088 0.816 0.816 7613 -0.983 1094 20140630 2014 ACET USD 387.384 0 47.516 55,608 0.816 29 510.179 A 1096 20141231 2014 MRCBF CAD 235.156 122.795 256.818 262.193 67.187 136.703 566.326 A 1097 20141231 2014 ACMTA USD 0.075 33117 1.489 1.676 68 977 0.888 5.102 A 1104 20141231 2014 ACU USD 67.137 4.84 7.694 9.394 3.164 4.789 107 222 A 1117 20141231 2014 RWC USD 16.599 40.085 2.528 3.713 30.691 1.623 30.971 A 1119 20141231 2014 ADX 14.372 10.659 1121 20141231 2014 AZ USD 4092645 6.953 31.568 6.523 4132.826 A 1161 20141231 2014 AMD USD 3552 40.181 149 278 8.613 -403 5506 A 1166 20141231 2014 ASMIY USD 351.407 1954 109.654 134,767 1676 166.156 660.235 A 1177 20141231 2014 AET USD 42911.7 308.828 4219.7 4848.7 174,061 2040.8 580032 A 1186 20141231 2014 AEM USD 1004.559 287.119 734.134 82.97 1896.766 A 1209 20140930 2014 APD USD 6677.7 15091.5 1603.7 2560.6 10242.8 991.7 10439 A 1210 20140331 2013 AIRT USD 84.567 892. 207 2.609 3.361 158.073 1,467 100.772 A 1224 20140930 2014 EGNI USD 3206 3761.3 62.2 96.6 1200,7 33 417.2 A 1225 20141231 2014 S01 USD 3814 16.205 1525 2128 12.844 900 5942 A 1228 20140630 2014 ALAN USD 0.266 96.6 0.917 0.735 -0.106 0.649 A 1230 20141231 2014 ALK USD 3635 2128 932 1226 605 5368 A 1234 20141231 2014 ATRI USD 63.521 0.383 40.817 49.54 1118 27.808 140.762 A 1254 20141231 2014 MATX USD 1365.4 133.4 201.5 507 70.8 1714.2 A 1257 20141231 2014 ALX USD 99.093 77.241 96.689 96.689 27.701 67.925 200.814 A 1262 20141231 2014 AGMF CAD 375.439 3488 57018 101.635 147.3 52.765 503.683 A 1263 20140331 2013 0065A CAD 1791.1 -201.1 -91.9 -313.8 1792.4 A 1266 20140930 2014 ALCO USD 58.41 101.721 10.156 18.036 5.032 8.05 88.68 A 1274 20141231 2014 Y USD 4030.899 128.244 994.561 1173.51 26.609 679.239 5204.409 A LCD 2760 CARD 7363 03 4330 ANALA COMPANIES Instruction BALANCE SHEET INCOME STATEINENT CASH FLOW STATEMENT STANDARD INDUSTRY CU Normal View Ready Sum-319507 21 22 23 24 25 26 27 28 1733 30 31 2 3 4 H K A24 fx A B D E SIC code Information 2 01-999 Agriculture, Forestry, Fishing 3 1000-1499 Mining 4 1500-1999 Construction 5 2000-3999 Manufacturing 6 4000-4999 Transportation & public Utilities 7 5000-5199 Wholesale Trade 8 5200-5999 Retail trade 9 6000-6999 Finance, Insurance, real estate 10 7000-9099 Services 11 9100-9999 Public adminstration 12 13 1 999 Agriculture, Forestry, Fishing 14 1000 1499 Mining 15 1500 1999 Construction 16 2000 3999 Manufacturing 17 4000 4999 Transportation & public Utilities 18 5000 5199 Wholesale Trade 19 5200 5999 Retail trade 20 6000 6999 Finance, Insurance, real estate 21 7000 9099 Services 22 9100 9900 Public adminstration 23 9999 24 25 26 27 28 29 30 31 ESTHERE SHEETCOVSTATIVIRAUTEUWSTATUWINTO waon Cash Propert and Cash y. Plant Cash Finanel Investin Operati and and Earning Equival Cash ng ng Active Short Current Equipm Retaine Stockho Before ents Dividen Activitie Activitie Activitie nactive Current Term Inventor Llabil Liabilitent d lders Cost of Interest Earning Net Capital Increas de 3- NetsNet - Net CIK Status Assets - Assets. Investm les- es es Total Earning Equity - Goods and s Before Income Revenu Expendi el(Decre (Cash Cash Cash Cash Number Marker Total Total ents Total Total Total (Net Parent Sold Taxes Interest (Loss) - Total tures ase) Flow) Flow Flow Flow 2011 A 3488 106798 176776 789019 200106 72971 A 40545 A 300109 A 19617 A 132601 9A 732712 A 70A 1341439 A 21344 A 712717 831001 A 11015 A 51143 1001099 A 1166091 A 1018724 2005 77476 A CASH FLOW STATEMENT STANDARD INDUSTRY CLASS INFO BALANCE SHEET INCOME STATEMENT Ready 01 Sumo Normal View co M Allowan ce for Account Allowan Funds Level of ce for Used Consell Payable Capital Cash Funds During Assets and dation - Used Expend Cash and Constru and Accrued Propert Dividen Cash Compan Depreci During ction Amortiz Llabilith Liabilit y, Plant ds on Equival ation Constru (Investition Global Data Annual Populati ISO and Commo ents- ction and (Cash Compan Data Current Te Other. Increas ng) Industry Descript on Year - De Data Ticker Capital Equipm Stock Increas Depletlo Debt- Currene (Cash (Cash Flow) - Net y Key Date Fiscal Formator all Decre Acquisit Expendient (Cash Source Format Symbol y Code Flow) Flow) el(Decren (Cash Change is Utility Change ase) lons tures 1004 20140531 Schd V Flow) . 2013 INDL D ase) STD Flow) 1045 20141211 153 2014 INO 265 26.5 STD AAL USD 10 1050 20141231 -26 2014 INDE C 110 0 D STO CICE USD 146 1062 20141130 -2.624 44.399 2014 INDL 1.151 c 1.151 STO -1.299 D ASA USD 1072 20140331 2011 NDL O STO AVX USD -152.75 1075 20141231 -169.535 c 1.6 2014 INOL 26.05 0 STO PNW USD 30. 30.9 63834 0353 1076 20141231 0 925.091 956.881 2014 INOL 246 671 D 496.487 -5.725 STD -1923 AAN USD 1126 - 13 1078 20141231 2014 INDE 47.50 47.545 c -227542 D STD ABT USD -195 3317 1084 20141231 C 2014 INDI 1077 1077 STD WODO USD 0 1094 20140630 0 0 2014 INDL C D STD 0.006 ACET USD 1096 20141231 13.909 86.14 1145 1145 2014 INDU C D STD 9.666 MRC CAD 6.766 1097 20141211 - 12.612 106.32 10632 20:4 INOL D STD -6213 ACMTA USD 1104 20141211 -1.578 0.294 0 0.084 c 0.084 2014 INDE D 0.312 STD ACU USD 3.981 13.06 1117 20141231 2042 2.042 O 2014 INDE c 9.35 D STD WC USD 1119 20141231 1.012 0 0.697 1.418 2014 NDI 0.67 D STO ADX USD 1121 20141231 2014 INDL C D STO AE USD 7.333 104 887 1161 20141211 30.523 30523 19.451 0 2014 INOL D STO AMD USD 95 95 1166 20141231 2014 IND c D STO ASMIN USD -5.3 2537 0 17.036 1177 20141231 2014 INDL c 37.086 D STD AET USD 1186 20141231 13775 450.5 3686 31 7016 2014 INDL C D STO AEM USD 31.558 -3.517 400.032 475.412 475.412 1209 20140930 2014 NOL C 38.436 STD APD USD 529 0 1684.2 16842 1210 20140331 2013 INDL C 1133 D STD AIRT USD 0.222 0.8 1224 20140930 1.284 1284 2014 INOL C D -5.439 STD EGNI USO -116 0 462 462 174 1225 20141211 275 14 2014 INDI c D STD 501 USO 49 3 201 1457 190 1228 20160630 550 -22 724 2014 INDU STD ALAN -0.129 0.212 0165 0.165 1230 20141231 0 0.510 2014 INDL D STO ALK USD 121 0 1234 20141231 27 2014 NDI D STD ATRI USD 0 1267 12.671 -2.784 1254 20141231 2014 INDI c D STO MATX USD 13.5 0 22.9 27.9 1789 BALANCE SHEET INCOME STATEMENT CASH FLOW STATEMENT STANDARD INDUSTRY CLASS INFO Q1+ Normal View Ready Sum 318970 ISO 2E402 1 2 3 4 5 6 7 8 2E07 USO H2 USD A B D Global Compan Data Data Year - Industry Ticker y Key Date Fiscal Format Symbol 1690 2E+07 2014 INDL AAPE 4503 2014 INDL XOM 2176 2E07 2014 INDL BRKB 160329 2E+07 2014 INDL GOOGL 12141 2E+07 2014 INDL MSFT 6266 2E+07 2014 INDL JNJ 8007 2E07 2014 INDE WEC 5047 2E407 2014 INDL GE 11259 2E07 2013 INDL WMT 2968 2E+07 2014 INDL JPM 170617 2E+07 2014 INDL FB 8762 2E+07 2014 INDL PG 2991 2E+02 2014 INDL CVX 8530 2014 INDL PFE 2136 2E07 2014 INDL VZ 7647 2E07 2014 INDL BAC 12142 2E+07 2013 INDL ORCL 3144 2E407 2014 INDL 9899 2E407 2014 INDL T 6008 2E07 2014 INDL INTC 3243 2E+07 2014 INDL C 7257 2E+07 2014 INOL MRK 6066 2E+07 2014 INDI IBM 3980 2E07 2014 INDL DIS 3226 2E407 2014 INDL CMCSA 64768 2E+07 2014 INDL AMZN 24856 2E+07 2014 INDL GILD 8479 2E+07 2014 INDL PEP 179534 2E07 2014 INDL V 20779 2E+07 2014 INDL CSCO 179621 2E+07 2014 INDL PM 24800 2E407 2014 INDL QCOM 1602 2E+07 2014 INDL AMGN 15633 2E07 2014 INDL RY 7241 2E407 2014 INDL CVS 9465 2E+07 2014 INDL SLB Instruction Normal View Ready 10 11 12 13 14 15 16 17 18 19 20 21 22 23 24 25 26 27 28 29 30 31 32 33 34 35 36 37 G H Stock CIK Active/Inacti Currency Exchange Numbe ve Status CUSIP Company Name Code Code r Marker 37833100 APPLE INC USD 14 320193 A 302316102 EXXON MOBIL CORP USD 11 34088 A 84670702 BERKSHIRE HATHAWAY USD 11 1067983 A 02079305 ALPHABET INC USD 14 1288776 A 594918104 MICROSOFT CORP USD 14 789019 A 478160104 JOHNSON & JOHNSON USD 11 200406 A 949746101 WELLS FARGO & CO USD 11 72971 A 369604103 GENERAL ELECTRIC CO USD 11 40545 A 931142103 WAL-MART STORES INC USD 11 104169 A 46625H100 JPMORGAN CHASE & CO USD 11 19617 A 30303M102 FACEBOOK INC USD 14 1326801 A 742718109 PROCTER & GAMBLE CO USD 11 80424 A 166764100 CHEVRON CORP USD 11 93410 A 717081103 PFIZER INC USD 11 78003 A 92343V104 VERIZON COMMUNICATIONS INC USD 11 732712 A GOSOS104 BANK OF AMERICA CORP 11 70858 A 68389x105 ORACLE CORP USD 11 1341439 A 191215100 COCA-COLA CO 11 21344 A 00206R102 ATATING USD 11 732717 A 458140100 INTEL CORP USD 14 50863 A 172967424 OTGROUPING USD 11 831001 A 58933Y105 MERCK & CO USD 11 310158 A 459200101 INTL BUSINESS MACHINES CORP USD 11 51143 A 254687106 DISNEY (WALTICO USD 11 1001039 A 20030N101 COMCAST CORP USD 14 1166691 A 23135106 AMAZON.COM INC USD 14 1018724 A 375558103 GILEAD SCENCES INC USD 14 882095 A 713448108 PEPSICO INC USD 11 77476 A 928260839 VISA INC USD 11 1403161 A 17275R102 CISCO SYSTEMS INC USD 14 858877 A 718172109 PHILIP MORRIS INTERNATIONAL USD 11 1413329 A 747525103 QUALCOMM INC USD 14 804328 A 31162100 AMGEN INC USD 14 318154 A 780087102 ROYAL BANK OF CANADA CAD 11 1000275 A 126650100 CVS HEALTH CORP USD 11 64803 A 806857108 SCHLUMBERGER LTD USD 11 87347 A ANI INCOME STATEMENT CASH FLOW STATEMENT STANDARD INDUSTRY CU Sumo USD COMPANIES BALANCE SHEET O ents > 0115 o 201157 2013 108 2014 2014 9 10 . B D K. Lo Consol dation Compan Cash and Property Global Data Debt in Annual Populati Short- ISO Current Accounts Plant and Compan Data Current Year Stockho Active Term Industry Descripton Data Ticker Inventor Equipmen Currene Assets Payable - Current Liabili ders y Key active Date Fiscal Formator Assets - Liabilities. Investm les. Source Format Symbol y Code Total t-Total Retained Liabilities Trade 2013 INDE Total Equity - Status Total AR Earnings - Total Total Total USD Parent Marker 1045 20141233 2014 INDL C c. D 892 STO AAL USD 2016 20141231 c INDE STO 2007 1004 CECE USD 142.357 454.365 2003 20041130 STO 2014 18.12 213141 181234 1072 20140331 c. STE USO 02 16 3075 20141231 2014 18 C STO PAW 9 US SSOS 92345 1972 235.25 1615 9476341431353 1096 20161231 337.303 2047685 760 2016 NOU D STO 1551 MAN 1119 USD 9857934 M 295 211 456.844 C D STO ANT 1295.24 12741 11222521 A US 2003 4125 2034 INDU 1034 20141231 C . D 1127 DOOR 19 U 1094 20140610 17 2014 NO STD A 27150 an 1096 20141211 0790 467 1.11 100.689 C 146.14 STO CAD 25330 4.736 7.64 3097 20141211 2014 NO 123.148 7472.18 C 281 S. M. 2005 A STD 7. UD 110420161211 5.159 C STO ACU USO 13671 our 6931 32.137 STO WWE 1119 2014123 12113 0218 1212 3541 1844 2016 NOL 0 .. 2014 INDL 3 MO814 1163 20141231 s 2014 INDL S60 183117 1537 AVO 0 665 685 1166 20141231 2014 IND TA 540 350 6132280.772 172 1753236 163 1177 20141231 599 2014 MT 165.461 2045311 A URD 11764 0 434 116 20141211 1556 358503 1436 C 1.209 2014093 793 TL 328666 7728 13 C APO 2395 177791 1250 2014 1634 SA 82513 2013 NOL 33 AIRT C D 31153 37.231 12 21916 9.019 2 1224 2014090 2054 INDL C 4721 110 4 O SB 531 BA 122520141231 2014 INDI C STO 155 w 305 273 15812 1228 20160630 2014 INDL 54115 ALAN C 16 2.394 mu 1. 4163 1230 20141211 4.75 A 2014 INDE c ALE STO 20 6151 1217 2009 16 4299 ST 123420341231 AT 2127 A 1671 2014 74196 . 171 514 2802 195 149.5 1254 2014121 c 2014 NO 21.544 STO MATX USD wa 14013 117 465 1757 20141251 1038 3638 2014 INOL C D STO AUX USD 459 1402256 337415 31461 D 2014 NOE 3439 A STO AGMUP CAD 341.25 NOSS 603219 58663 366.556 1263 20160831 2013 NOL D STO CAD 4869 1043 -1079 23351 COMPANIES BALANCE SHEET INCOME STATEMENT CASH FLOW STATEMENT STANDARD INDUSTRY CU Now Ready Sum 318970 12 13 14 15 16 17 18 19 0 ws PECE 7341 O TOES 21 6840538 THE RE go . non 25 26 27 SCT BRE 0 0 > 0 O O 1 non VIA PS Formatting A11350 fx 319507 d H M N 1 2 3 4 5 6 7 8 9 10 11 12 13 14 15 16 17 18 19 USD Earning s Before Selling, Active/ Global Data ISO Cost of Gross Interest Earning General and Net nactive Compan Data Year - Ticker Currenc Goods Profit and s Before Administrati Income Revenu Status y Key Date Fiscal Symbol y Code Sold (Loss) Taxes Interest ve Expense (Loss) e - Total Marker 1004 20140531 2013 AIR USD 1581.4 453.6 142.6 256 1976 72.9 2035 A 1045 20141231 2014 AAL USO 35065 13139 5073 6585 6554 2882 42650 A 1050 20141231 2014 CECE USD 176.177 87.04 24.332 35.6 51.44 13.077 263.217 A 1062 20141130 2014 ASA USD 3.677 -1.458 -1.458 -27.775 2.219 A 1072 20140331 2013 AVX USD 1113 561 -1.458 159.164 209.373 127.037 1442.604 A 1075 20141231 2014 PNW USD 2263.032 329,043 811.242 1228.6 119.67 397.595 3491.632 A 1076 20141231 2014 AAN USD 354.598 1228.6 176 1194.234 78.233 2725.239 A 1078 20141231 2014 ABT USD 8159 2370.641 2927 4475 1176.407 2284 20247 A 1084 20141231 2014 WDDD USD 0 12088 0.816 0.816 7613 -0.983 1094 20140630 2014 ACET USD 387.384 0 47.516 55,608 0.816 29 510.179 A 1096 20141231 2014 MRCBF CAD 235.156 122.795 256.818 262.193 67.187 136.703 566.326 A 1097 20141231 2014 ACMTA USD 0.075 33117 1.489 1.676 68 977 0.888 5.102 A 1104 20141231 2014 ACU USD 67.137 4.84 7.694 9.394 3.164 4.789 107 222 A 1117 20141231 2014 RWC USD 16.599 40.085 2.528 3.713 30.691 1.623 30.971 A 1119 20141231 2014 ADX 14.372 10.659 1121 20141231 2014 AZ USD 4092645 6.953 31.568 6.523 4132.826 A 1161 20141231 2014 AMD USD 3552 40.181 149 278 8.613 -403 5506 A 1166 20141231 2014 ASMIY USD 351.407 1954 109.654 134,767 1676 166.156 660.235 A 1177 20141231 2014 AET USD 42911.7 308.828 4219.7 4848.7 174,061 2040.8 580032 A 1186 20141231 2014 AEM USD 1004.559 287.119 734.134 82.97 1896.766 A 1209 20140930 2014 APD USD 6677.7 15091.5 1603.7 2560.6 10242.8 991.7 10439 A 1210 20140331 2013 AIRT USD 84.567 892. 207 2.609 3.361 158.073 1,467 100.772 A 1224 20140930 2014 EGNI USD 3206 3761.3 62.2 96.6 1200,7 33 417.2 A 1225 20141231 2014 S01 USD 3814 16.205 1525 2128 12.844 900 5942 A 1228 20140630 2014 ALAN USD 0.266 96.6 0.917 0.735 -0.106 0.649 A 1230 20141231 2014 ALK USD 3635 2128 932 1226 605 5368 A 1234 20141231 2014 ATRI USD 63.521 0.383 40.817 49.54 1118 27.808 140.762 A 1254 20141231 2014 MATX USD 1365.4 133.4 201.5 507 70.8 1714.2 A 1257 20141231 2014 ALX USD 99.093 77.241 96.689 96.689 27.701 67.925 200.814 A 1262 20141231 2014 AGMF CAD 375.439 3488 57018 101.635 147.3 52.765 503.683 A 1263 20140331 2013 0065A CAD 1791.1 -201.1 -91.9 -313.8 1792.4 A 1266 20140930 2014 ALCO USD 58.41 101.721 10.156 18.036 5.032 8.05 88.68 A 1274 20141231 2014 Y USD 4030.899 128.244 994.561 1173.51 26.609 679.239 5204.409 A LCD 2760 CARD 7363 03 4330 ANALA COMPANIES Instruction BALANCE SHEET INCOME STATEINENT CASH FLOW STATEMENT STANDARD INDUSTRY CU Normal View Ready Sum-319507 21 22 23 24 25 26 27 28 1733 30 31 2 3 4 H K A24 fx A B D E SIC code Information 2 01-999 Agriculture, Forestry, Fishing 3 1000-1499 Mining 4 1500-1999 Construction 5 2000-3999 Manufacturing 6 4000-4999 Transportation & public Utilities 7 5000-5199 Wholesale Trade 8 5200-5999 Retail trade 9 6000-6999 Finance, Insurance, real estate 10 7000-9099 Services 11 9100-9999 Public adminstration 12 13 1 999 Agriculture, Forestry, Fishing 14 1000 1499 Mining 15 1500 1999 Construction 16 2000 3999 Manufacturing 17 4000 4999 Transportation & public Utilities 18 5000 5199 Wholesale Trade 19 5200 5999 Retail trade 20 6000 6999 Finance, Insurance, real estate 21 7000 9099 Services 22 9100 9900 Public adminstration 23 9999 24 25 26 27 28 29 30 31 ESTHERE SHEETCOVSTATIVIRAUTEUWSTATUWINTO waon Cash Propert and Cash y. Plant Cash Finanel Investin Operati and and Earning Equival Cash ng ng Active Short Current Equipm Retaine Stockho Before ents Dividen Activitie Activitie Activitie nactive Current Term Inventor Llabil Liabilitent d lders Cost of Interest Earning Net Capital Increas de 3- NetsNet - Net CIK Status Assets - Assets. Investm les- es es Total Earning Equity - Goods and s Before Income Revenu Expendi el(Decre (Cash Cash Cash Cash Number Marker Total Total ents Total Total Total (Net Parent Sold Taxes Interest (Loss) - Total tures ase) Flow) Flow Flow Flow 2011 A 3488 106798 176776 789019 200106 72971 A 40545 A 300109 A 19617 A 132601 9A 732712 A 70A 1341439 A 21344 A 712717 831001 A 11015 A 51143 1001099 A 1166091 A 1018724 2005 77476 A CASH FLOW STATEMENT STANDARD INDUSTRY CLASS INFO BALANCE SHEET INCOME STATEMENT Ready 01 Sumo Normal View co M Allowan ce for Account Allowan Funds Level of ce for Used Consell Payable Capital Cash Funds During Assets and dation - Used Expend Cash and Constru and Accrued Propert Dividen Cash Compan Depreci During ction Amortiz Llabilith Liabilit y, Plant ds on Equival ation Constru (Investition Global Data Annual Populati ISO and Commo ents- ction and (Cash Compan Data Current Te Other. Increas ng) Industry Descript on Year - De Data Ticker Capital Equipm Stock Increas Depletlo Debt- Currene (Cash (Cash Flow) - Net y Key Date Fiscal Formator all Decre Acquisit Expendient (Cash Source Format Symbol y Code Flow) Flow) el(Decren (Cash Change is Utility Change ase) lons tures 1004 20140531 Schd V Flow) . 2013 INDL D ase) STD Flow) 1045 20141211 153 2014 INO 265 26.5 STD AAL USD 10 1050 20141231 -26 2014 INDE C 110 0 D STO CICE USD 146 1062 20141130 -2.624 44.399 2014 INDL 1.151 c 1.151 STO -1.299 D ASA USD 1072 20140331 2011 NDL O STO AVX USD -152.75 1075 20141231 -169.535 c 1.6 2014 INOL 26.05 0 STO PNW USD 30. 30.9 63834 0353 1076 20141231 0 925.091 956.881 2014 INOL 246 671 D 496.487 -5.725 STD -1923 AAN USD 1126 - 13 1078 20141231 2014 INDE 47.50 47.545 c -227542 D STD ABT USD -195 3317 1084 20141231 C 2014 INDI 1077 1077 STD WODO USD 0 1094 20140630 0 0 2014 INDL C D STD 0.006 ACET USD 1096 20141231 13.909 86.14 1145 1145 2014 INDU C D STD 9.666 MRC CAD 6.766 1097 20141211 - 12.612 106.32 10632 20:4 INOL D STD -6213 ACMTA USD 1104 20141211 -1.578 0.294 0 0.084 c 0.084 2014 INDE D 0.312 STD ACU USD 3.981 13.06 1117 20141231 2042 2.042 O 2014 INDE c 9.35 D STD WC USD 1119 20141231 1.012 0 0.697 1.418 2014 NDI 0.67 D STO ADX USD 1121 20141231 2014 INDL C D STO AE USD 7.333 104 887 1161 20141211 30.523 30523 19.451 0 2014 INOL D STO AMD USD 95 95 1166 20141231 2014 IND c D STO ASMIN USD -5.3 2537 0 17.036 1177 20141231 2014 INDL c 37.086 D STD AET USD 1186 20141231 13775 450.5 3686 31 7016 2014 INDL C D STO AEM USD 31.558 -3.517 400.032 475.412 475.412 1209 20140930 2014 NOL C 38.436 STD APD USD 529 0 1684.2 16842 1210 20140331 2013 INDL C 1133 D STD AIRT USD 0.222 0.8 1224 20140930 1.284 1284 2014 INOL C D -5.439 STD EGNI USO -116 0 462 462 174 1225 20141211 275 14 2014 INDI c D STD 501 USO 49 3 201 1457 190 1228 20160630 550 -22 724 2014 INDU STD ALAN -0.129 0.212 0165 0.165 1230 20141231 0 0.510 2014 INDL D STO ALK USD 121 0 1234 20141231 27 2014 NDI D STD ATRI USD 0 1267 12.671 -2.784 1254 20141231 2014 INDI c D STO MATX USD 13.5 0 22.9 27.9 1789 BALANCE SHEET INCOME STATEMENT CASH FLOW STATEMENT STANDARD INDUSTRY CLASS INFO Q1+ Normal View Ready Sum 318970
Step by Step Solution
There are 3 Steps involved in it

Get step-by-step solutions from verified subject matter experts