

Question: ISYS 2 1 0 3 : Data Analytics Case Study Scenario: You are the regional manager of the Q . CInn, a nationwide chain of
ISYS : Data Analytics Case Study
Scenario: You are the regional manager of the QCInn, a nationwide chain of affordable motels for vacationing families & business travelers. You will be preparing year end reports for QCInn franchises located in NebraskaSouth Dakota region.
Open QC Inn file & save as QCInnyourfirstnamelastname: Example: QCInnJohnDoe, Fill out Documentation Sheet with Your Name & Date. Review the data on the Motels & Terms & Definitions Sheets. On the Motels Sheet: Complete the Occupancy Rates, ADR & ReV ParColumns K M & N
Create PivotTables to answer the following questions:
NOTE: Format ALL Value fields accordinglyaccounting or currenc commas & NO decimals: For an example: $
When complete: Submit in Blackboard: HW Assignment # PivotTables
Total number of Rooms rented each Year
Total Revenue by Motel Total:
Total Rooms rented by Region & State Region:
State:
Tofal Motel Rooms & Rooms Rented per City Total Motel Rooms:
Rooms rented per city:
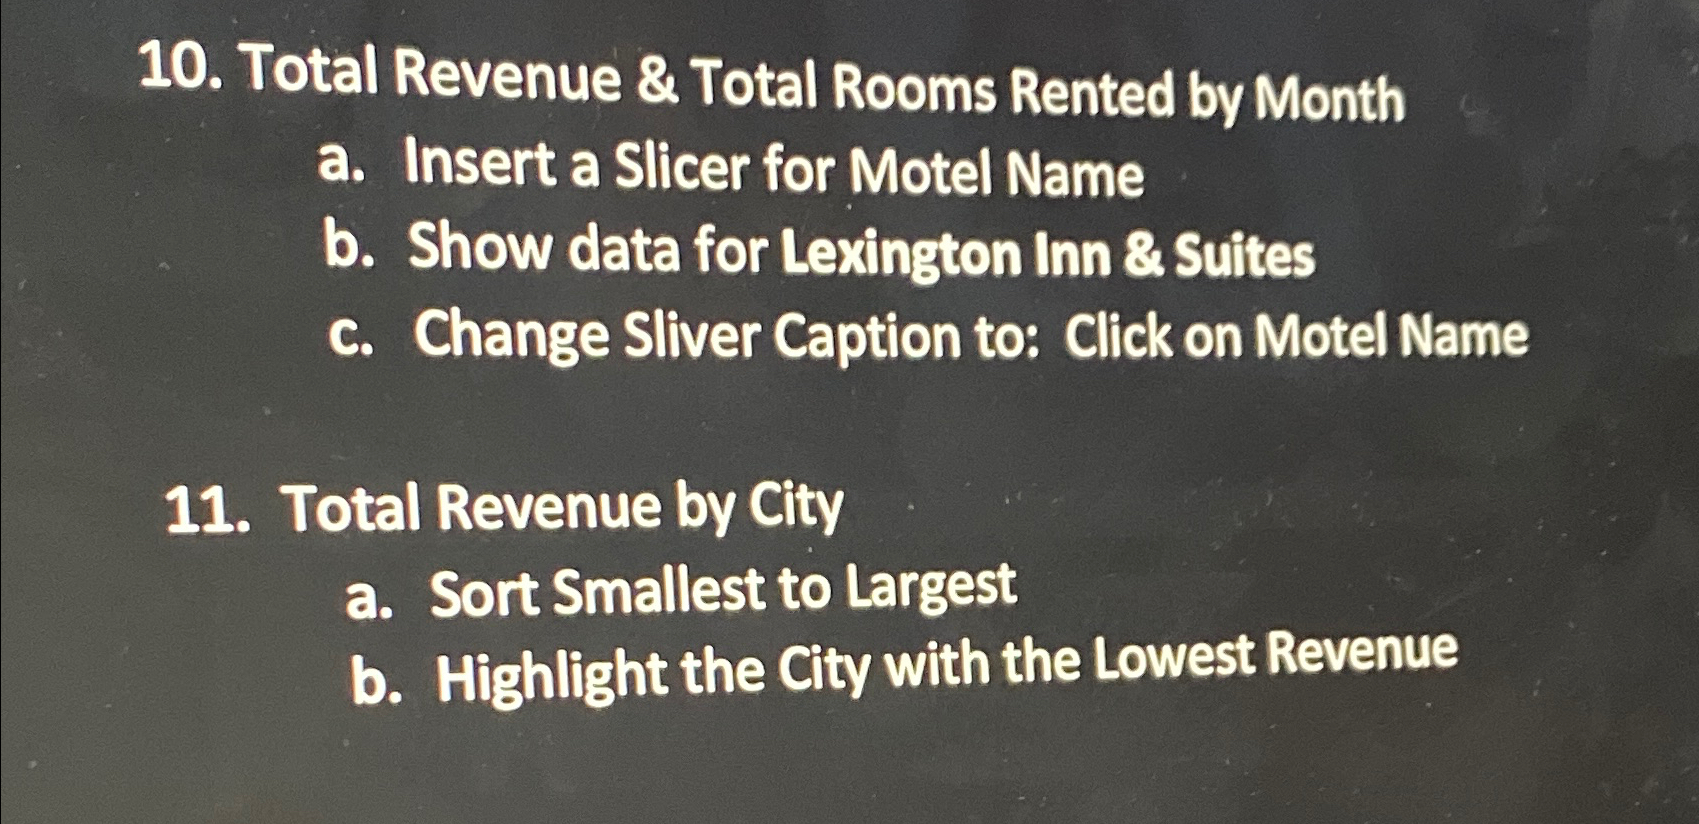
Total Revenue & Total Rooms Rented by Month
a Insert a Slicer for Motel Name
b Show data for Lexington Inn & Suites
c Change Sliver Caption to: Click on Motel Name
Total Revenue by City
a Sort Smallest to Largest
b Highlight the City with the Lowest Revenue
Total Revenue by Year
a Create a Clustered Column Chart
b Chart Title: QC Inn: Total Revenue by Year
c Remove the Legend
d Format: Your choice
Step by Step Solution
There are 3 Steps involved in it
1 Expert Approved Answer
Step: 1 Unlock

Question Has Been Solved by an Expert!
Get step-by-step solutions from verified subject matter experts
Step: 2 Unlock
Step: 3 Unlock