

Question: it is all on one question, the original graph is this. Somehow we can scroll it to see the area and the normal approximation -0.5
it is all on one question, the original graph is this. Somehow we can scroll it to see the area and the normal approximation
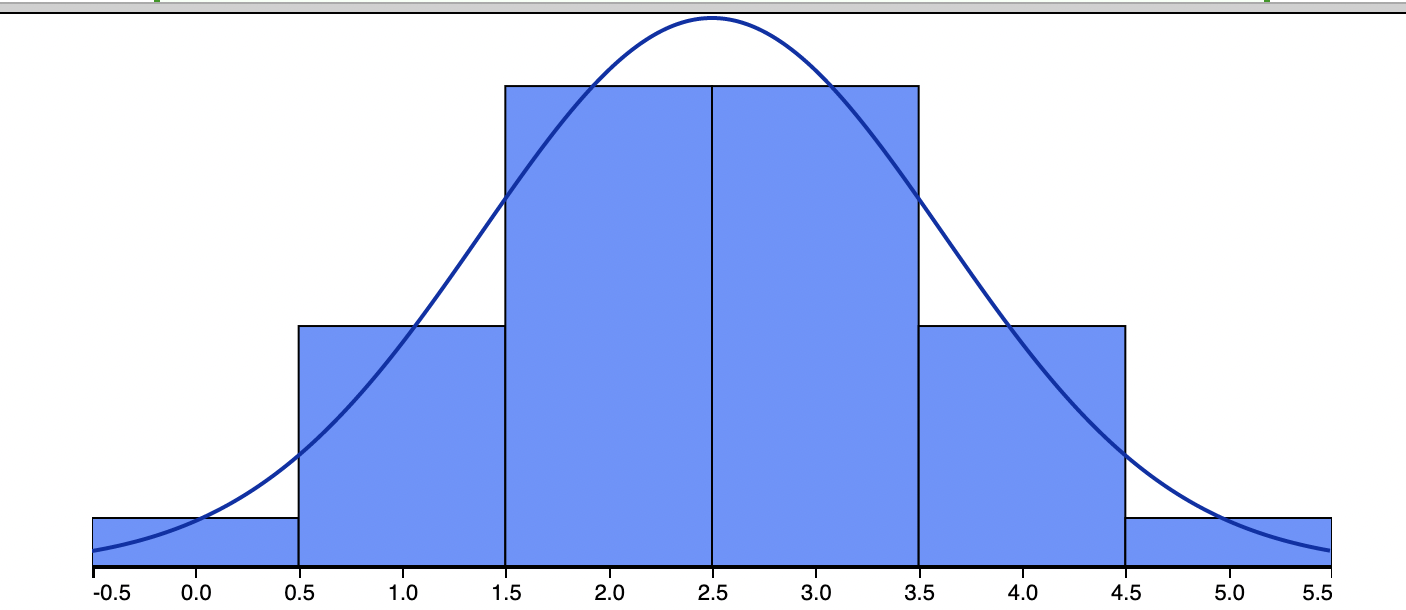
![histogram and the normal approximation for a single bin is (06) C]](https://s3.amazonaws.com/si.experts.images/answers/2024/07/668dac0076463_640668dac0057f03.jpg)
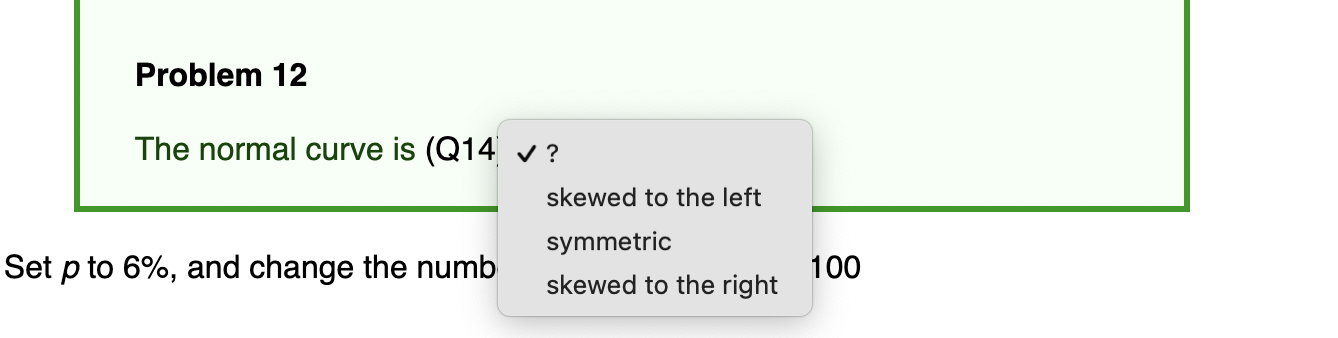
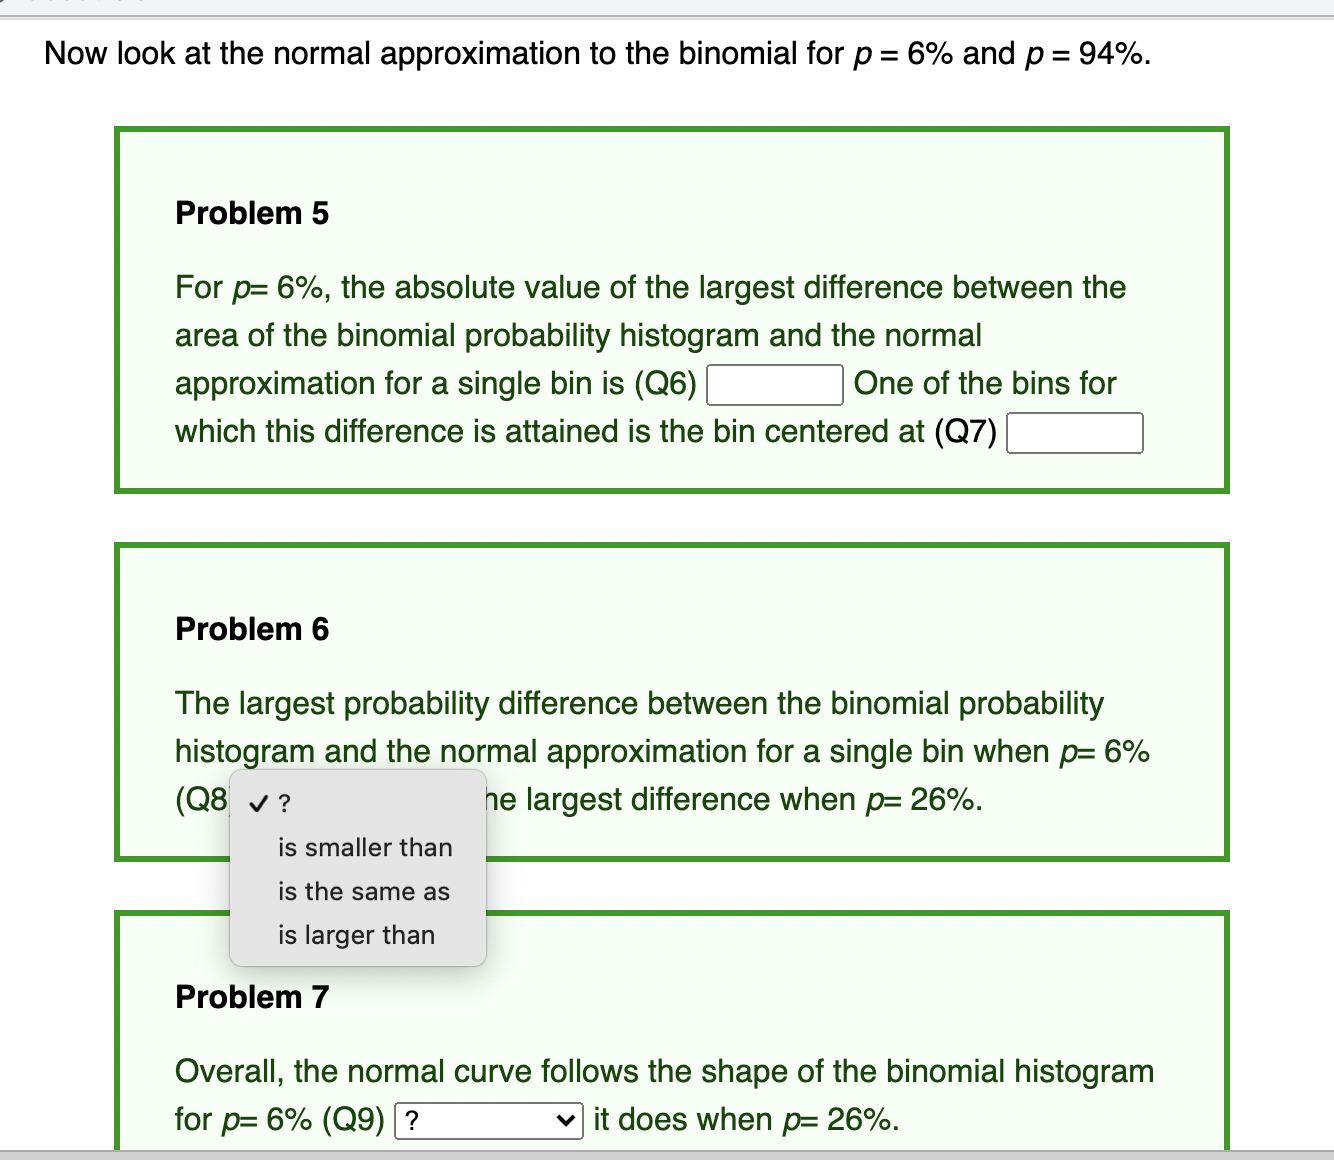
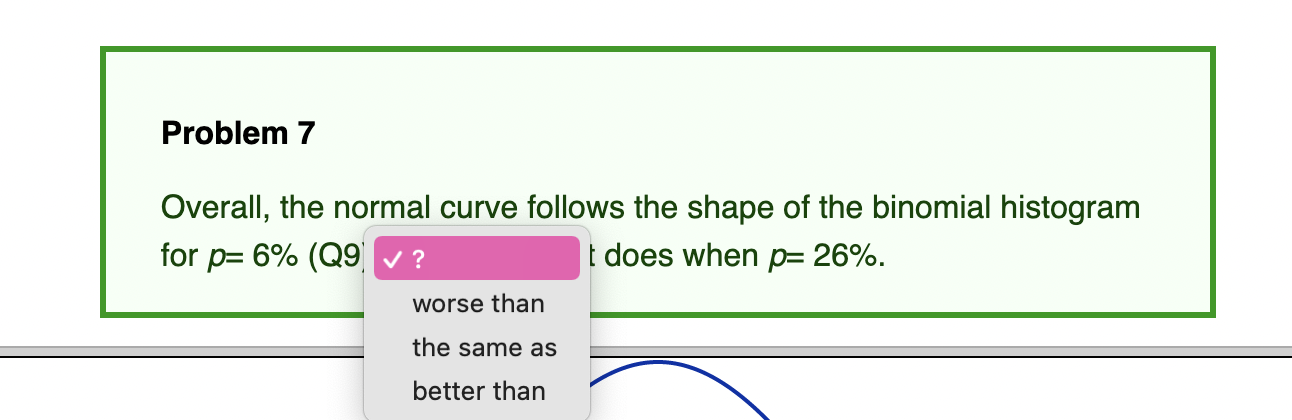
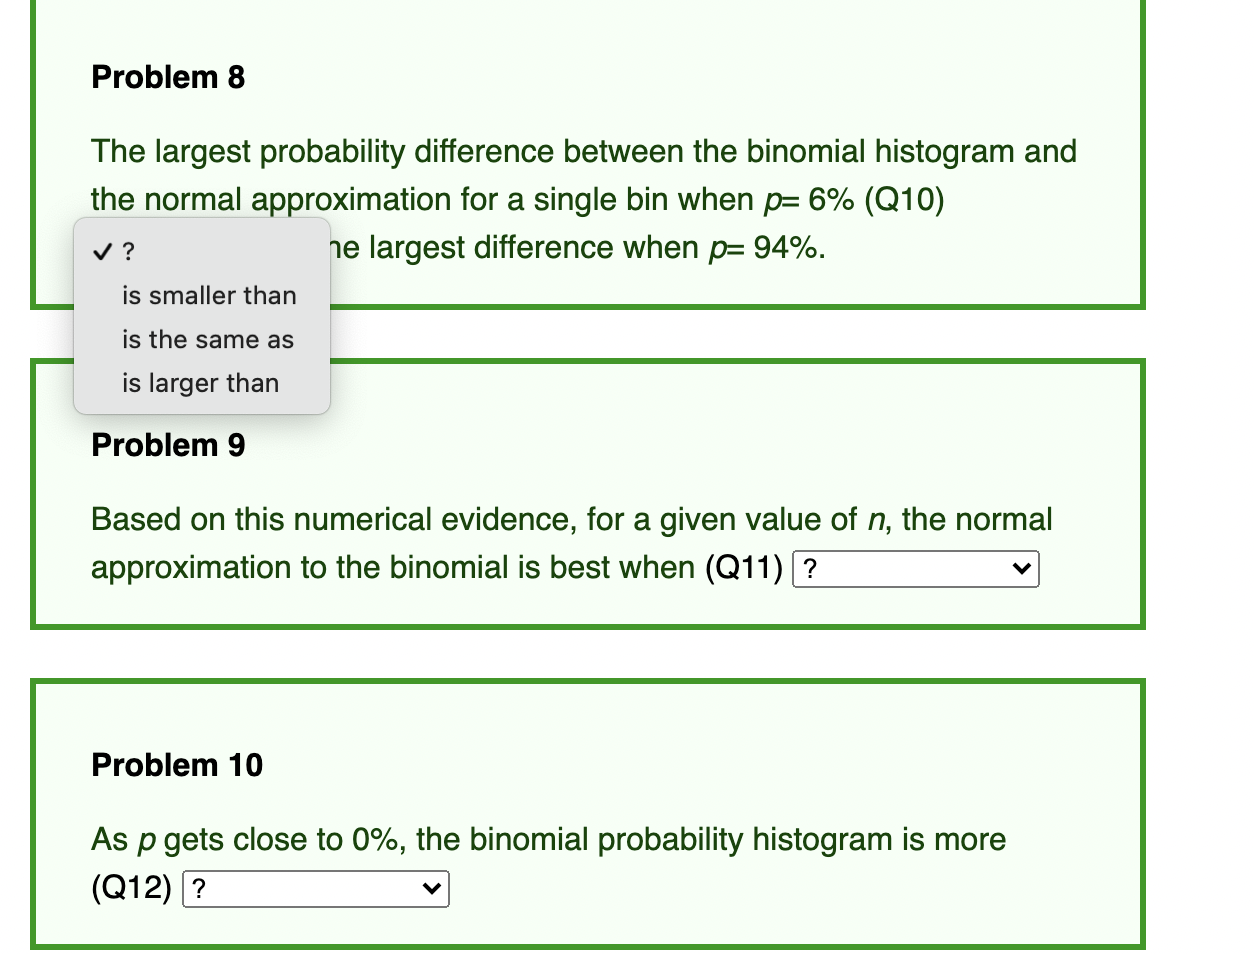
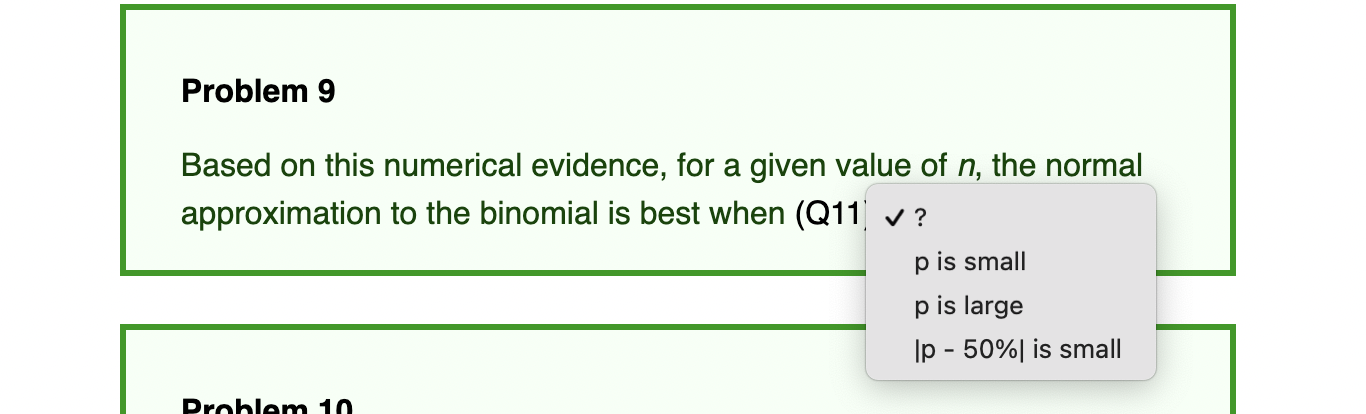
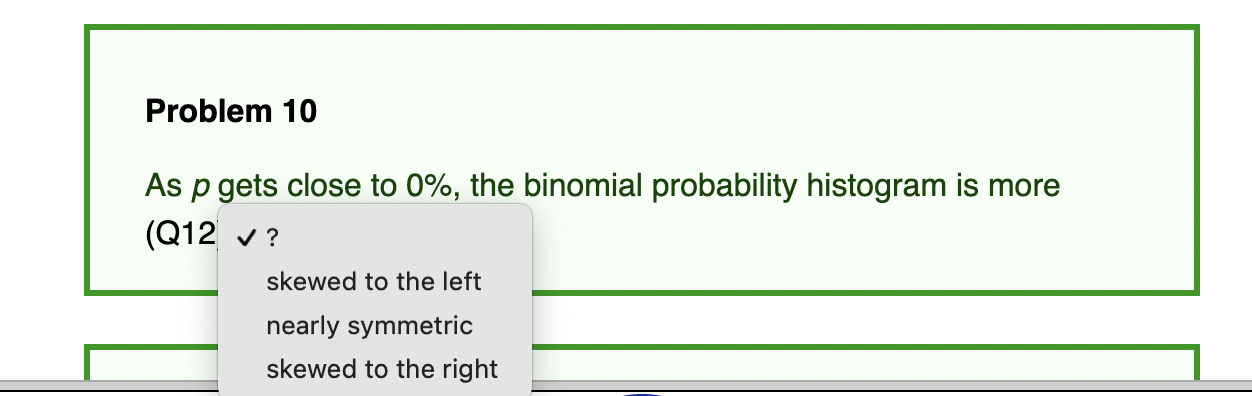
-0.5 0.0 0.5 1.0 1.5 2.0 2.5 3.0 3.5 4.0 4.5 5.0 5.5Now look at the normal approximation to the binomial for p = 6% and p = 94%. Problem 5 For p: 6%, the absolute value of the largest difference between the area of the binomial probability histogram and the normal approximation for a single bin is (06) C] One of the bins for which this difference is attained is the bin centered at (07) :1 Problem 6 The largest probability difference between the binomial probability histog ram and the normal approximation for a single bin when p: 6% e largest difference when p: 26%. is smaller than is the same as is larger than Problem 7 Overall, the normal curve follows the shape of the binomial histogram for p: 6% (09) it does when p: 26%. Problem 7 Overall, the normal curve follows the shape of the binomial histogram for p= 6% (Q9) V ? does when p= 26%. worse than the same as better thanProblem 8 The largest probability difference between the binomial histogram and __ the normal approximation for a single bin when p: 6% (010) v ? e largest difference when p: 94%. is smaller than is the same as is larger than Problem 9 Based on this numerical evidence, for a given value of n, the normal approximation to the binomial is best when (011) Problem 10 As p gets close to 0%, the binomial probability histogram is more (012) Problem 9 Based on this numerical evidence, for a given value of n, the normal approximation to the binomial is best when (Q11 I ? p is small p is large |p - 50%| is small Drnhlam 1n Problem 10 As p gets close to 0%, the binomial probability histogram is more (012 .z ? ' skewed to the left nearly symmetric skewed to the right Problem 11 As p gets close to 100%, the binomial probability histogram is more skewed to the left nearly symmetric skewed to the rig ht Problem 12 The normal curve is (Q14 v ? skewed to the left symmetric Set p to 6%, and change the numb 100 skewed to the right
Step by Step Solution
There are 3 Steps involved in it

Get step-by-step solutions from verified subject matter experts