

Question: It is easier to analyze Apple before or after preparing the trend analysis. Why ? Refer to the series of income statements and the trend
It is easier to analyze Apple before or after preparing the trend analysis. Why?
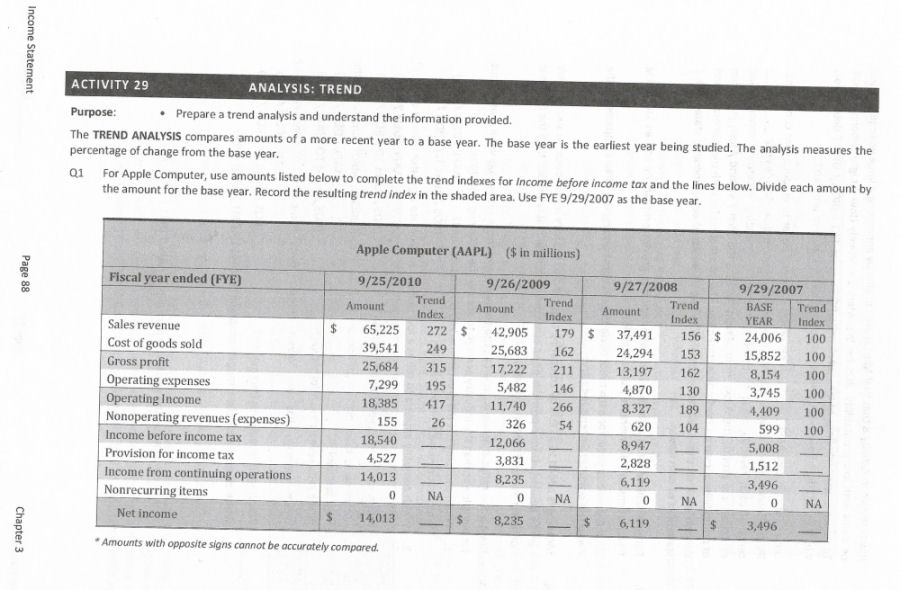
Refer to the series of income statements and the trend analysis on the previous page to answer the following questions. Q2 Sales growth was 172 % (272-100) from FYE 9-29-2007 to FYE 9-25-2010 with the greatest increase during FYE (9-25-10/9-26-09/9-27-08/9-29-07). When sales revenue increases, expenses would be expected to (increase / stay the same / decrease). It is favorable when sales revenue increases by 172 % and expenses increase at a (higher lower) rate than 172%. If an expense account increases at a rate greater than sales revenue, this indicates costs (were kept under control / got out of control) From FYE 9-29-2007 to FYE 9-25-2010, which of the following expenses increased at a greater rate than sales revenue? (COGS/Operating expenses / Provision for income tax). For Apple, the most important cost to keep under control is (COGS/ operating expenses / provision for income tax). Overall, it appears that Apple costs (were kept under control / got out of control) The FYE 9-25-2010 trend index for Sales Revenue of 272 is (greater /less) than 100, indicating the amount for that year is (about the same as / almost double / almost triple) the (base year / previous year) amount. The FYE 9-25-2010 trend index for Net Income of 401 is (greater less) than 100, indicating the amount for that year is (about the same as / double / quadrupled) the (base year previous year) amount. (Sales revenue / Net Income) increased at a greater rate, indicating (revenues/ expenses) increased at a greater rate from FYE 9-29-2007 to FYE 9-25-2010, which is (favorable /unfavorable). Q3 Q4 The annual revenue growth rate can be compared between companies. Q5 Assume less than 5 % is low, 5 to 15 % is moderate, and more than 15% is high. The three-year average revenue growth rate is (low / moderate / high). Q6 Compute gross profit margin (Gross profit/Sales revenue) for fiscal years ended: 9-25-2010 %; 9-27-2008 During this time period the gross profit margin (increased / decreased), which is a(n) (favorable / % ; 9-29-2007 33.97 % %; 9-26-2009 unfavorable) trend. What does this trend indicate? Compute the Retun on Sales (Net income/Sales revenue) for fiscal years ended: 9-25-2010 During this time period ROS (increased/decreased), which is a(n) (favorable /unfavorable) trend. What does this trend indicate? Q7 %; 9-27-2008 % ; 9/29/2007 14.56 % %; 9-26-2009 Operationally, the best year was FYE (9-25-10/9-26-09/9-27-08/9-29-07). Why? List as many items as you can to support your response. Q8 Operationally, the worst year was FYE (9-25-10/9-26-09/9-27-08/9-29-07). Why? List as many items as you can to support your response. Q9 t is easier to analyze Apple (before/after) preparing the trend analysis. Why? Q10 Income Statement Page 89 Chapter 3 ACTIVITY 29 ANALYSIS: TREND Prepare a trend analysis and understand the information provided Purpose: The TREND ANALYSIS Compares amounts of a more recent year to a base year. The base year is the earliest year being studied. The analysis measures the percentage of change from the base year. For Apple Computer, use amounts listed below to complete the trend indexes for Income before income tax and the lines below. Divide each amount by the amount for the base year. Record the resulting trend index in the shaded area. Use FYE 9/29/2007 as the base year. a1 Apple Computer (AAPL) ($ in millions) Fiscal year ended (FYE) 9/25/2010 9/26/2009 9/27/2008 9/29/2007 Trend Trend Amount Trend BASE Amount Trend Amount Index Index Index YEAR Index Sales revenue 65,225 272 S 42,905 179 37,491 156 24,006 100 Cost of goods sold Gross profit Operating expenses Operating Income Nonoperating revenues (expenses) Income before income tax 39,541 249 25,683 162 24,294 153 15,852 100 25,684 315 17,222 211 13,197 162 8,154 100 7,299 195 5,482 146 4,870 130 3,745 100 18,385 417 11,740 266 8,327 189 4,409 100 155 26 326 54 620 104 599 100 18,540 12,066 8,947 5,008 Provision for income tax 4,527 3,831 2,828 1,512 Income from continuing operations Nonrecurring items 14,013 8,235 6,119 3,496 0 NA 0 NA 0 NA NA Net income $ 14,013 8,235 6,119 3,496 Amounts with opposite signs cannot be accurately compared Income Statement Page 88 Chapter 3 Refer to the series of income statements and the trend analysis on the previous page to answer the following questions. Q2 Sales growth was 172 % (272-100) from FYE 9-29-2007 to FYE 9-25-2010 with the greatest increase during FYE (9-25-10/9-26-09/9-27-08/9-29-07). When sales revenue increases, expenses would be expected to (increase / stay the same / decrease). It is favorable when sales revenue increases by 172 % and expenses increase at a (higher lower) rate than 172%. If an expense account increases at a rate greater than sales revenue, this indicates costs (were kept under control / got out of control) From FYE 9-29-2007 to FYE 9-25-2010, which of the following expenses increased at a greater rate than sales revenue? (COGS/Operating expenses / Provision for income tax). For Apple, the most important cost to keep under control is (COGS/ operating expenses / provision for income tax). Overall, it appears that Apple costs (were kept under control / got out of control) The FYE 9-25-2010 trend index for Sales Revenue of 272 is (greater /less) than 100, indicating the amount for that year is (about the same as / almost double / almost triple) the (base year / previous year) amount. The FYE 9-25-2010 trend index for Net Income of 401 is (greater less) than 100, indicating the amount for that year is (about the same as / double / quadrupled) the (base year previous year) amount. (Sales revenue / Net Income) increased at a greater rate, indicating (revenues/ expenses) increased at a greater rate from FYE 9-29-2007 to FYE 9-25-2010, which is (favorable /unfavorable). Q3 Q4 The annual revenue growth rate can be compared between companies. Q5 Assume less than 5 % is low, 5 to 15 % is moderate, and more than 15% is high. The three-year average revenue growth rate is (low / moderate / high). Q6 Compute gross profit margin (Gross profit/Sales revenue) for fiscal years ended: 9-25-2010 %; 9-27-2008 During this time period the gross profit margin (increased / decreased), which is a(n) (favorable / % ; 9-29-2007 33.97 % %; 9-26-2009 unfavorable) trend. What does this trend indicate? Compute the Retun on Sales (Net income/Sales revenue) for fiscal years ended: 9-25-2010 During this time period ROS (increased/decreased), which is a(n) (favorable /unfavorable) trend. What does this trend indicate? Q7 %; 9-27-2008 % ; 9/29/2007 14.56 % %; 9-26-2009 Operationally, the best year was FYE (9-25-10/9-26-09/9-27-08/9-29-07). Why? List as many items as you can to support your response. Q8 Operationally, the worst year was FYE (9-25-10/9-26-09/9-27-08/9-29-07). Why? List as many items as you can to support your response. Q9 t is easier to analyze Apple (before/after) preparing the trend analysis. Why? Q10 Income Statement Page 89 Chapter 3 ACTIVITY 29 ANALYSIS: TREND Prepare a trend analysis and understand the information provided Purpose: The TREND ANALYSIS Compares amounts of a more recent year to a base year. The base year is the earliest year being studied. The analysis measures the percentage of change from the base year. For Apple Computer, use amounts listed below to complete the trend indexes for Income before income tax and the lines below. Divide each amount by the amount for the base year. Record the resulting trend index in the shaded area. Use FYE 9/29/2007 as the base year. a1 Apple Computer (AAPL) ($ in millions) Fiscal year ended (FYE) 9/25/2010 9/26/2009 9/27/2008 9/29/2007 Trend Trend Amount Trend BASE Amount Trend Amount Index Index Index YEAR Index Sales revenue 65,225 272 S 42,905 179 37,491 156 24,006 100 Cost of goods sold Gross profit Operating expenses Operating Income Nonoperating revenues (expenses) Income before income tax 39,541 249 25,683 162 24,294 153 15,852 100 25,684 315 17,222 211 13,197 162 8,154 100 7,299 195 5,482 146 4,870 130 3,745 100 18,385 417 11,740 266 8,327 189 4,409 100 155 26 326 54 620 104 599 100 18,540 12,066 8,947 5,008 Provision for income tax 4,527 3,831 2,828 1,512 Income from continuing operations Nonrecurring items 14,013 8,235 6,119 3,496 0 NA 0 NA 0 NA NA Net income $ 14,013 8,235 6,119 3,496 Amounts with opposite signs cannot be accurately compared Income Statement Page 88 Chapter 3
Step by Step Solution
There are 3 Steps involved in it
Comprehensive Response to Apple Trend Analysis Questions FYE 20072010 Q1 Q9 Is it easier to analyze Apple before or after preparing the trend analysis Why Answer It is easier to analyze Apple after pr... View full answer

Get step-by-step solutions from verified subject matter experts