

Question: it is mgmt Examine the below chart to answer the following questions: R Day 1 2. 3 3 4 X-Bar 27 28 29 26 27
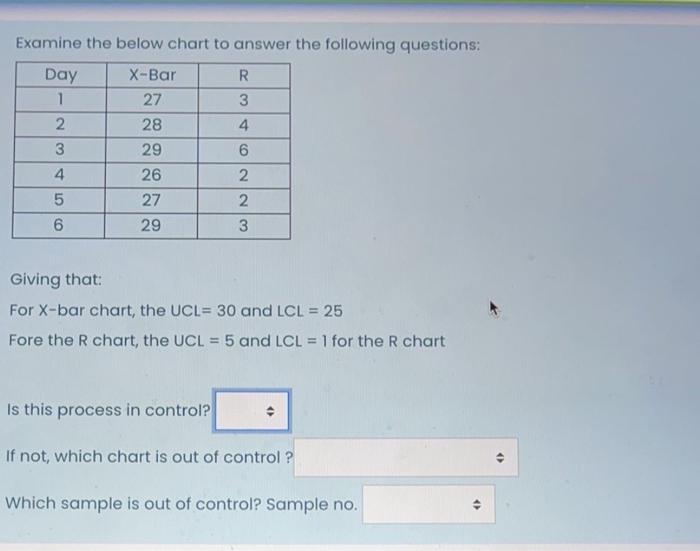
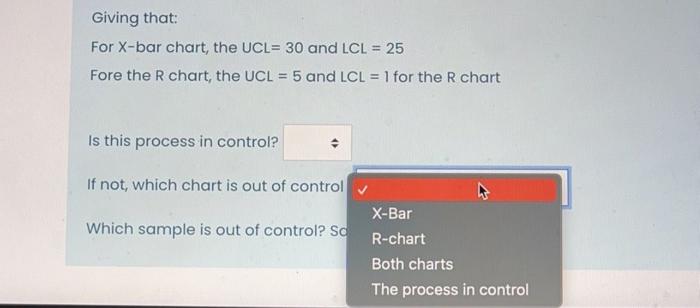
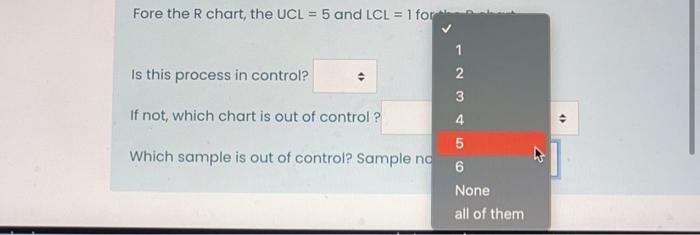
Examine the below chart to answer the following questions: R Day 1 2. 3 3 4 X-Bar 27 28 29 26 27 29 4 W NNO 5 6 Giving that: For X-bar chart, the UCL= 30 and LCL = 25 Fore the R chart, the UCL = 5 and LCL = 1 for the R chart Is this process in control? If not, which chart is out of control ? 0 Which sample is out of control? Sample no. . Giving that: For X-bar chart, the UCL= 30 and LCL = 25 Fore the R chart, the UCL = 5 and LCL = 1 for the R chart Is this process in control? If not, which chart is out of control Which sample is out of control? Sa X-Bar R-chart Both charts The process in control Fore the R chart, the UCL = 5 and LCL = 1 for 1 Is this process in control? 2 3 If not, which chart is out of control ? 4 5 Which sample is out of control? Sample ng 6 None all of them
Step by Step Solution
There are 3 Steps involved in it

Get step-by-step solutions from verified subject matter experts