

Question: It is your first day on the job at EquiPhase, and you've come across a set of seemingly random financial information. Your boss asks you
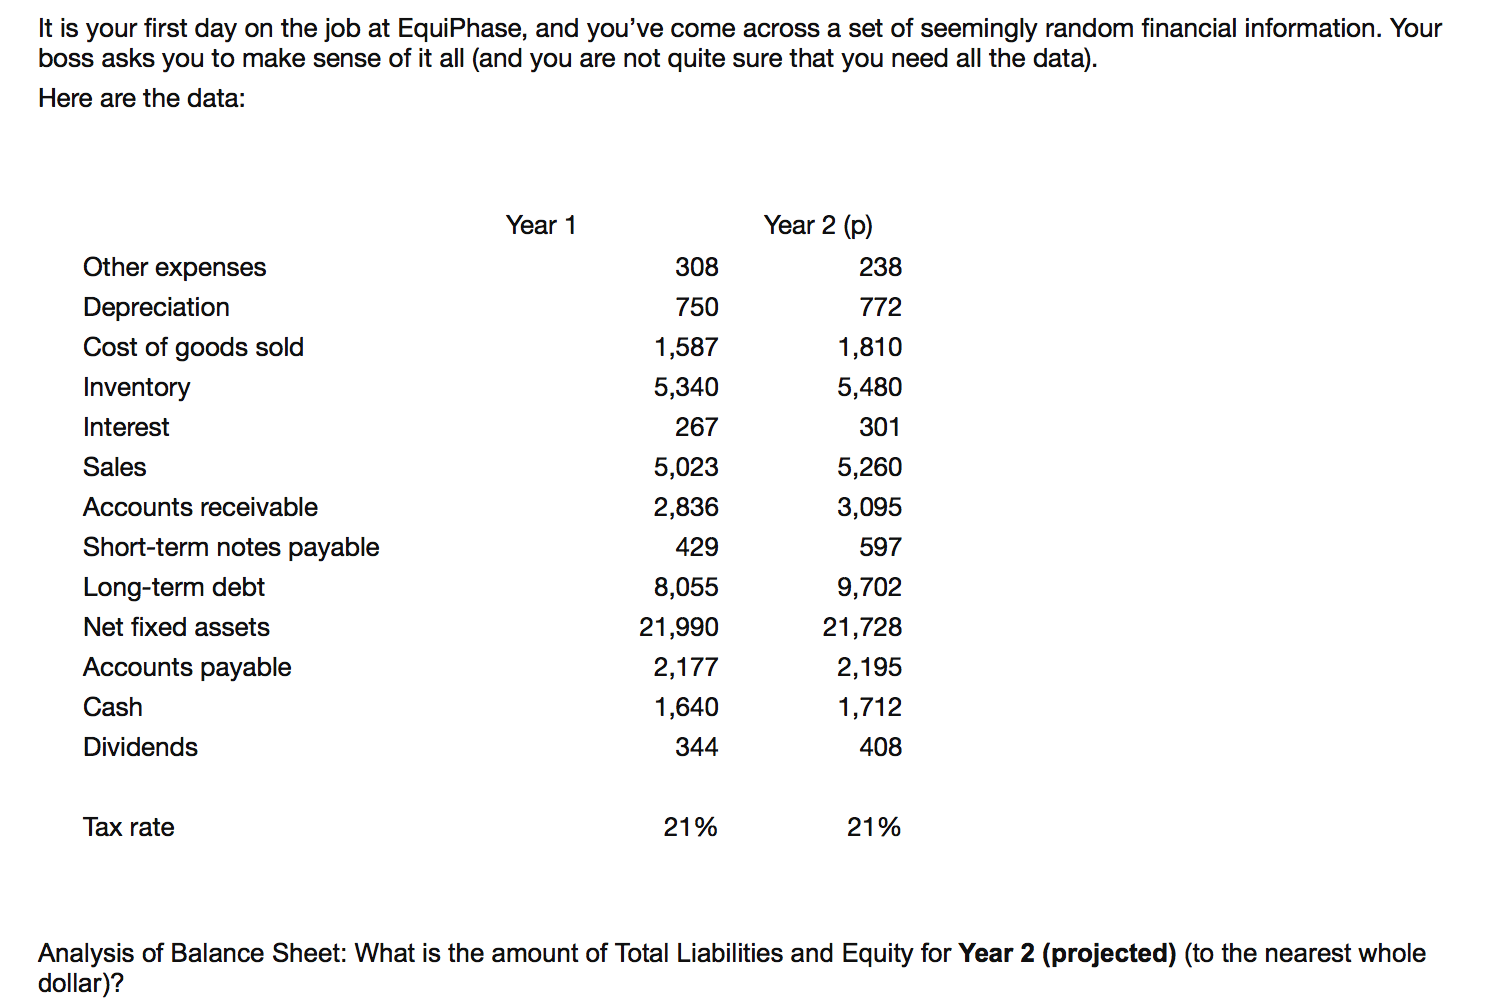
It is your first day on the job at EquiPhase, and you've come across a set of seemingly random financial information. Your boss asks you to make sense of it all (and you are not quite sure that you need all the data). Here are the data: Year 1 Other expenses Depreciation Cost of goods sold Inventory Interest Sales 308 750 1,587 5,340 267 5,023 2,836 429 8,055 21,990 2,177 1,640 344 Accounts receivable Short-term notes payable Long-term debt Net fixed assets Accounts payable Cash Dividends Year 2 (p) 238 772 1,810 5,480 301 5,260 3,095 597 9,702 21,728 2,195 1,712 408 Tax rate 21% 21% Analysis of Balance Sheet: What is the amount of Total Liabilities and Equity for Year 2 (projected) (to the nearest whole dollar)
Step by Step Solution
There are 3 Steps involved in it

Get step-by-step solutions from verified subject matter experts