

Question: It needs SPSS where needed. 10 A computer company has asked his staff to compare customer satisfaction at its computer care technical services in San
It needs SPSS where needed.
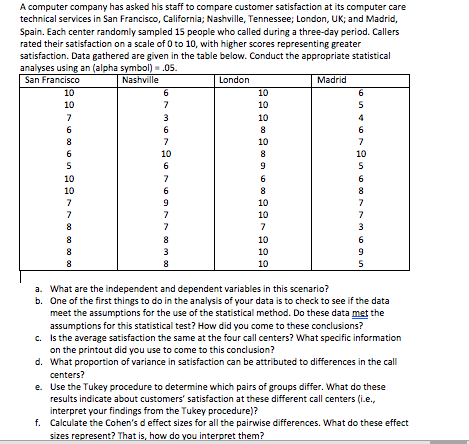
10 A computer company has asked his staff to compare customer satisfaction at its computer care technical services in San Francisco, California, Nashville, Tennessee, London, UK; and Madrid, Spain. Each center randomly sampled 15 people who called during a three-day period. Callers rated their satisfaction on a scale of 0 to 10, with higher scores representing greater satisfaction. Data gathered are given in the table below. Conduct the appropriate statistical analyses using an (alpha symbol) - .05. San Francisco Nashville London Madrid 10 6 10 6 7 10 5 7 3 10 6 6 8 6 8 7 7 6 8 10 5 9 5 10 7 6 6 10 6 8 8 7 9 10 7 7 7 10 7 7 7 3 8 8 6 8 3 10 9 8 8 10 5 10 10 00 00 00 00 10 a. What are the independent and dependent variables in this scenario? b. One of the first things to do in the analysis of your data is to check to see if the data meet the assumptions for the use of the statistical method. Do these data met the assumptions for this statistical test? How did you come to these conclusions? c. Is the average satisfaction the same at the four call centers? What specific information on the printout did you use to come to this conclusion? d. What proportion of variance in satisfaction can be attributed to differences in the call centers? e. Use the Tukey procedure to determine which pairs of groups differ. What do these results indicate about customers' satisfaction at these different call centers (i.e. interpret your findings from the Tukey procedure)? f. Calculate the Cohen's d effect sizes for all the pairwise differences. What do these effect sizes represent? That is, how do you interpret them? 10 A computer company has asked his staff to compare customer satisfaction at its computer care technical services in San Francisco, California, Nashville, Tennessee, London, UK; and Madrid, Spain. Each center randomly sampled 15 people who called during a three-day period. Callers rated their satisfaction on a scale of 0 to 10, with higher scores representing greater satisfaction. Data gathered are given in the table below. Conduct the appropriate statistical analyses using an (alpha symbol) - .05. San Francisco Nashville London Madrid 10 6 10 6 7 10 5 7 3 10 6 6 8 6 8 7 7 6 8 10 5 9 5 10 7 6 6 10 6 8 8 7 9 10 7 7 7 10 7 7 7 3 8 8 6 8 3 10 9 8 8 10 5 10 10 00 00 00 00 10 a. What are the independent and dependent variables in this scenario? b. One of the first things to do in the analysis of your data is to check to see if the data meet the assumptions for the use of the statistical method. Do these data met the assumptions for this statistical test? How did you come to these conclusions? c. Is the average satisfaction the same at the four call centers? What specific information on the printout did you use to come to this conclusion? d. What proportion of variance in satisfaction can be attributed to differences in the call centers? e. Use the Tukey procedure to determine which pairs of groups differ. What do these results indicate about customers' satisfaction at these different call centers (i.e. interpret your findings from the Tukey procedure)? f. Calculate the Cohen's d effect sizes for all the pairwise differences. What do these effect sizes represent? That is, how do you interpret them
Step by Step Solution
There are 3 Steps involved in it
1 Expert Approved Answer
Step: 1 Unlock

Question Has Been Solved by an Expert!
Get step-by-step solutions from verified subject matter experts
Step: 2 Unlock
Step: 3 Unlock