

Question: It will be very helpful if you explain and explain how to solve it on excel. Thank you. Que 3. a) Calculate the portfolio's expected
 It will be very helpful if you explain and explain how to solve it on excel. Thank you.
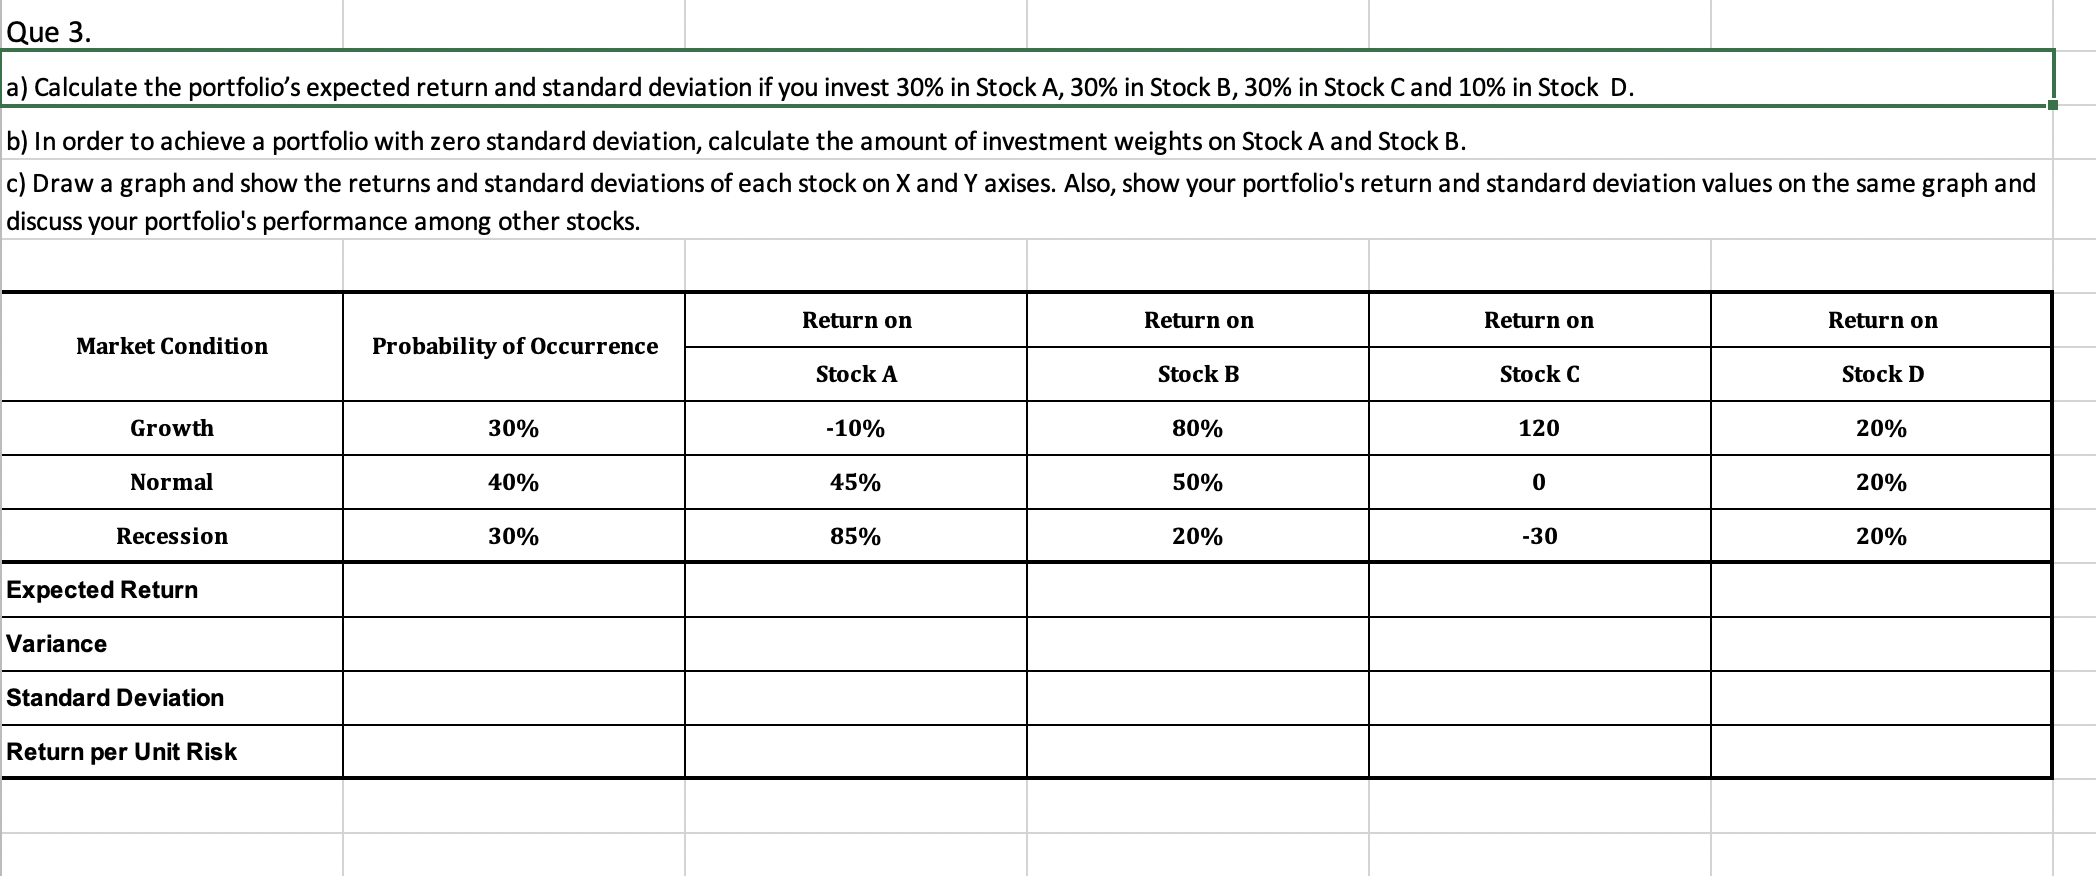
Que 3. a) Calculate the portfolio's expected return and standard deviation if you invest 30% in Stock A, 30% in Stock B, 30% in Stock Cand 10% in Stock D. b) In order to achieve a portfolio with zero standard deviation, calculate the amount of investment weights on Stock A and Stock B. c) Draw a graph and show the returns and standard deviations of each stock on X and Y axises. Also, show your portfolio's return and standard deviation values on the same graph and discuss your portfolio's performance among other stocks. Return on Return on Return on Return on Market Condition Probability of Occurrence Stock A Stock B Stock C Stock D Growth 30% -10% 80% 120 20% Normal 40% 45% 50% 0 20% Recession 30% 85% 20% -30 20% Expected Return Variance Standard Deviation Return per Unit Risk Que 3. a) Calculate the portfolio's expected return and standard deviation if you invest 30% in Stock A, 30% in Stock B, 30% in Stock Cand 10% in Stock D. b) In order to achieve a portfolio with zero standard deviation, calculate the amount of investment weights on Stock A and Stock B. c) Draw a graph and show the returns and standard deviations of each stock on X and Y axises. Also, show your portfolio's return and standard deviation values on the same graph and discuss your portfolio's performance among other stocks. Return on Return on Return on Return on Market Condition Probability of Occurrence Stock A Stock B Stock C Stock D Growth 30% -10% 80% 120 20% Normal 40% 45% 50% 0 20% Recession 30% 85% 20% -30 20% Expected Return Variance Standard Deviation Return per Unit Risk
Step by Step Solution
There are 3 Steps involved in it

Get step-by-step solutions from verified subject matter experts