

Question: It would be nice if this was written on paper:)The data is on the right-hand side for LeBron James points per game over last 21
It would be nice if this was written on paper:)The data is on the right-hand side for "LeBron James points per game over last 21 NBA seasons"
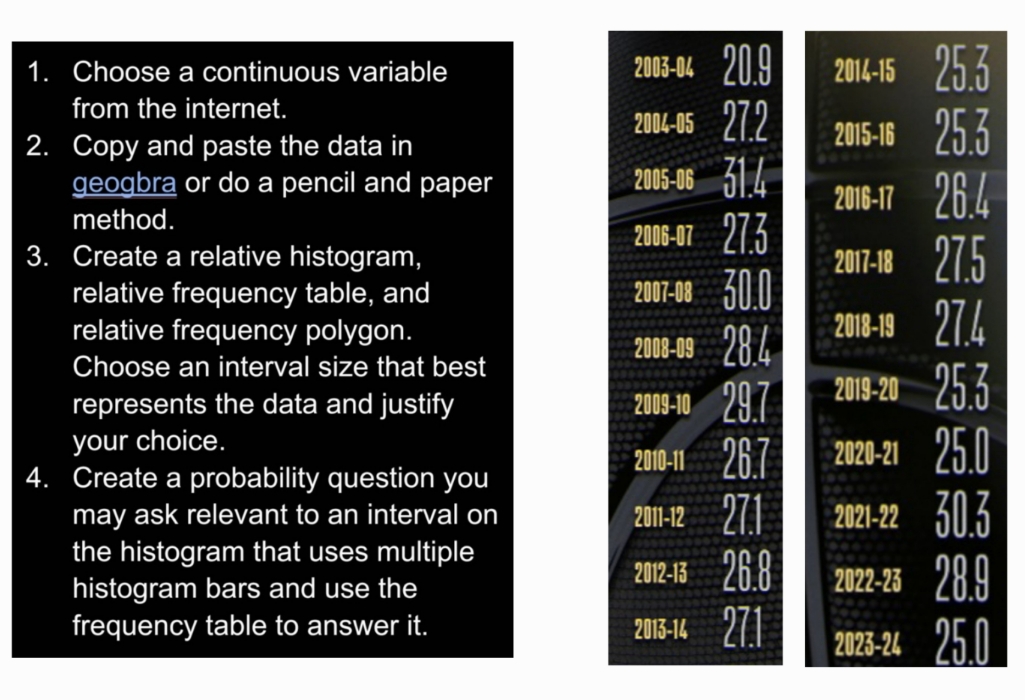
1. Choose a continuous variable 2003-04 20.9 2014-15 25.3 from the internet. 2004-05 27.2 2. Copy and paste the data in 2015-16 25.3 geogbra or do a pencil and paper 2005-06 31.4 2016-17 26.4 method. 2006-07 27.3 3. Create a relative histogram, 2017-18 27.5 relative frequency table, and 2007-08 30.0 relative frequency polygon. 2018-19 27.4 2008-09 28.4 Choose an interval size that best 29.7 2019-20 represents the data and justify 2009-10 25.3 your choice. 2010-11 4. Create a probability question you 26.7 2020-21 25.0 may ask relevant to an interval on 2011-12 27.1 2021-22 30.3 the histogram that uses multiple 2012-13 histogram bars and use the 26.8 2022-23 28.9 frequency table to answer it. 2013-14 27.1 2023-24 25.0
Step by Step Solution
There are 3 Steps involved in it

Get step-by-step solutions from verified subject matter experts