

Question: ITE 5 3 0 3 Big Data 2 Consider the table shown in the figure. Q 2 ( 5 marks ) Using the igraph library,
ITE
Big Data
Consider the table shown
in the figure.
Q marks
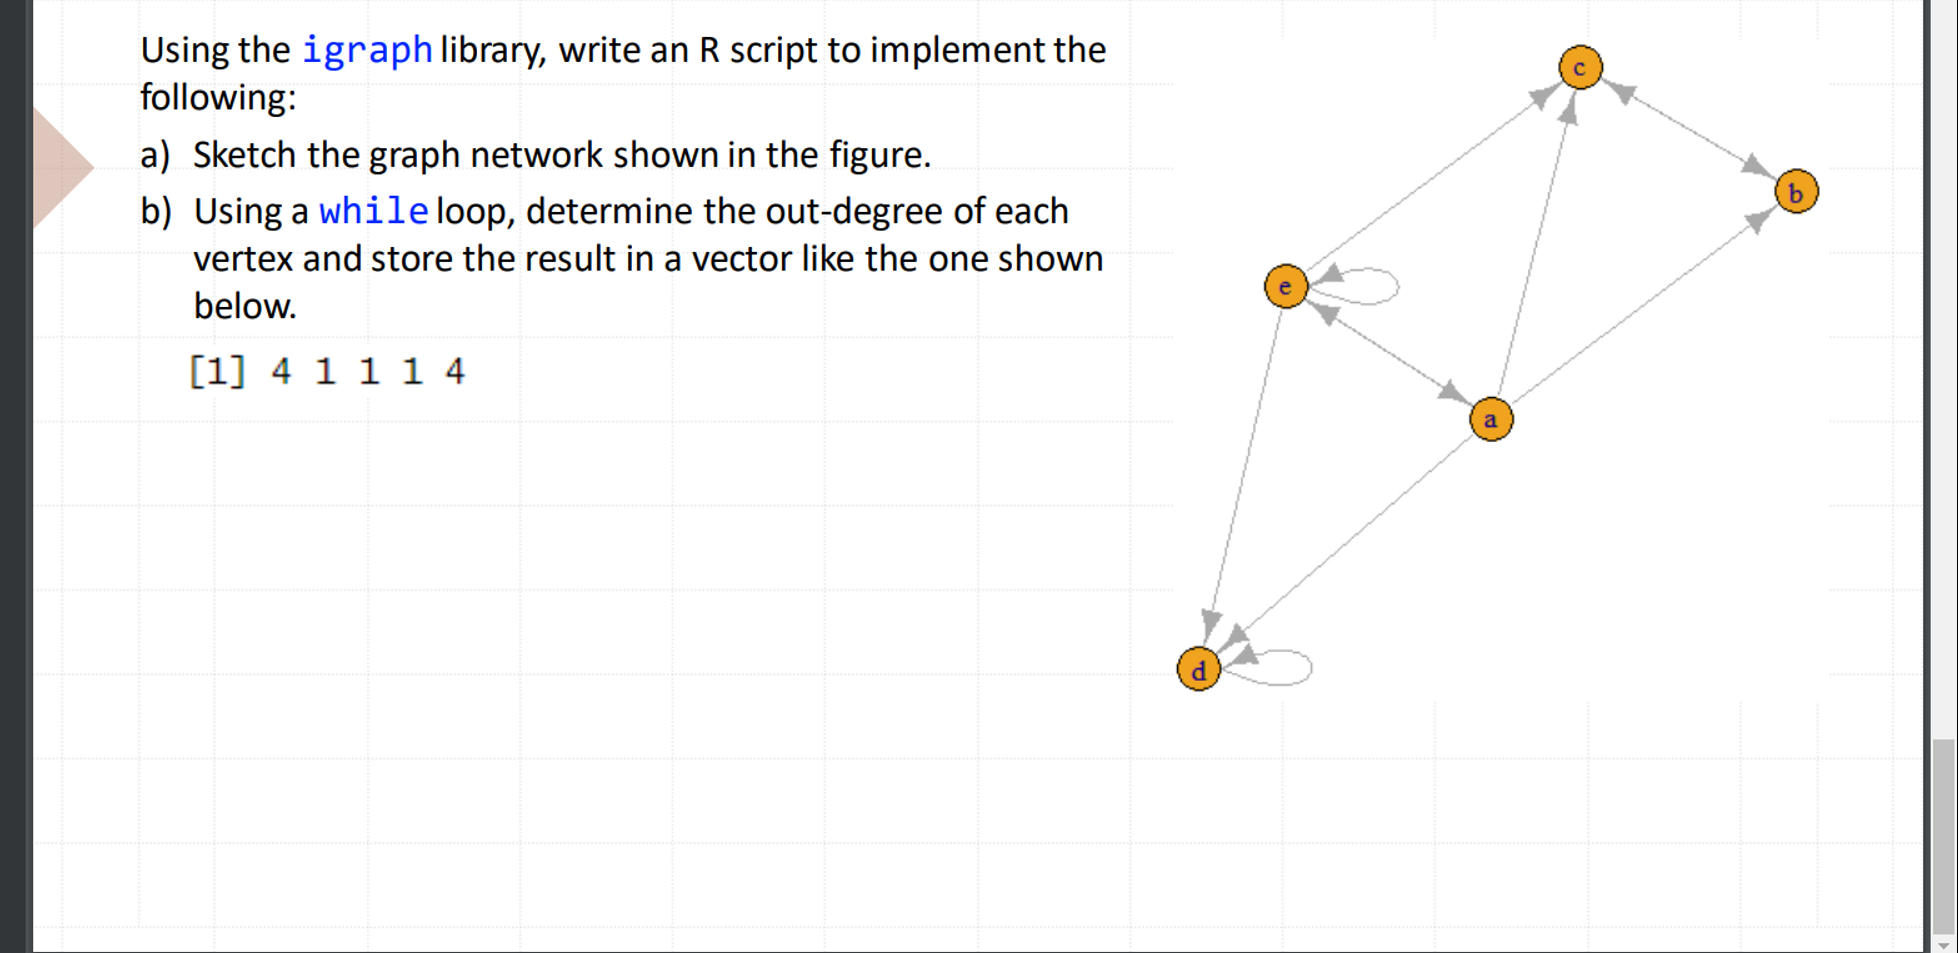
Using the igraph library, write an R script to implement the following:
a Sketch the graph network shown in the figure.
b Using a while loop, determine the outdegree of each vertex and store the result in a vector like the one shown below.
Step by Step Solution
There are 3 Steps involved in it
1 Expert Approved Answer
Step: 1 Unlock

Question Has Been Solved by an Expert!
Get step-by-step solutions from verified subject matter experts
Step: 2 Unlock
Step: 3 Unlock