

Question: its 1 assignment Need answers immediately File Tools View BUS 8375 loc. 9 Assignment Source Data for Analysis of Antwers Fall 2020 Protected ViewSaved to
its 1 assignment Need answers immediately
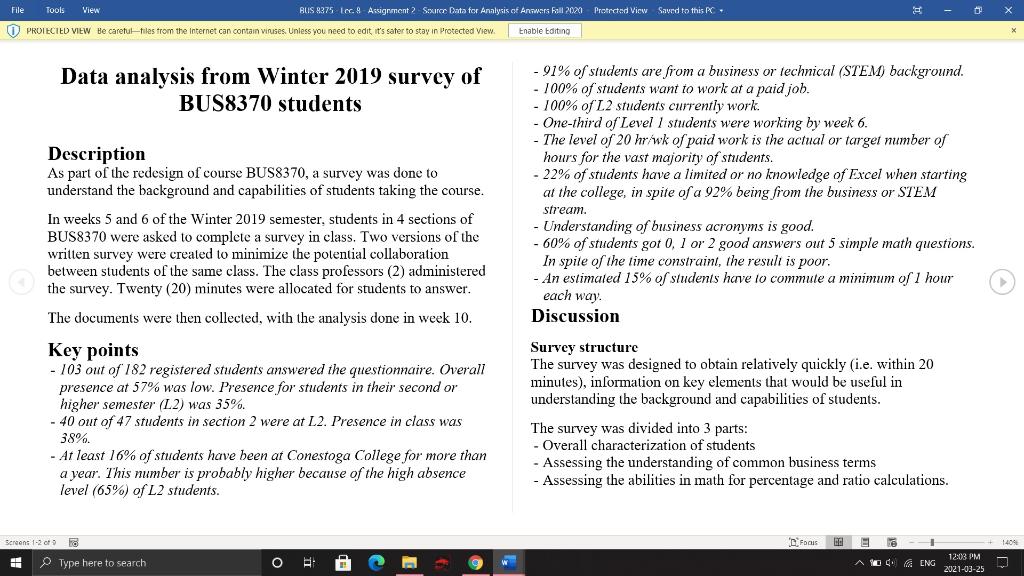
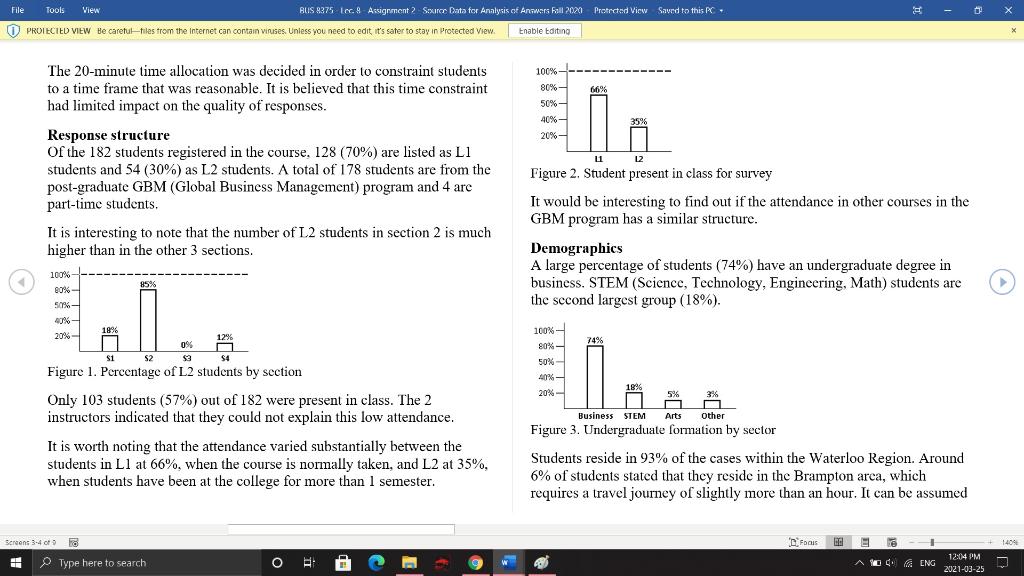
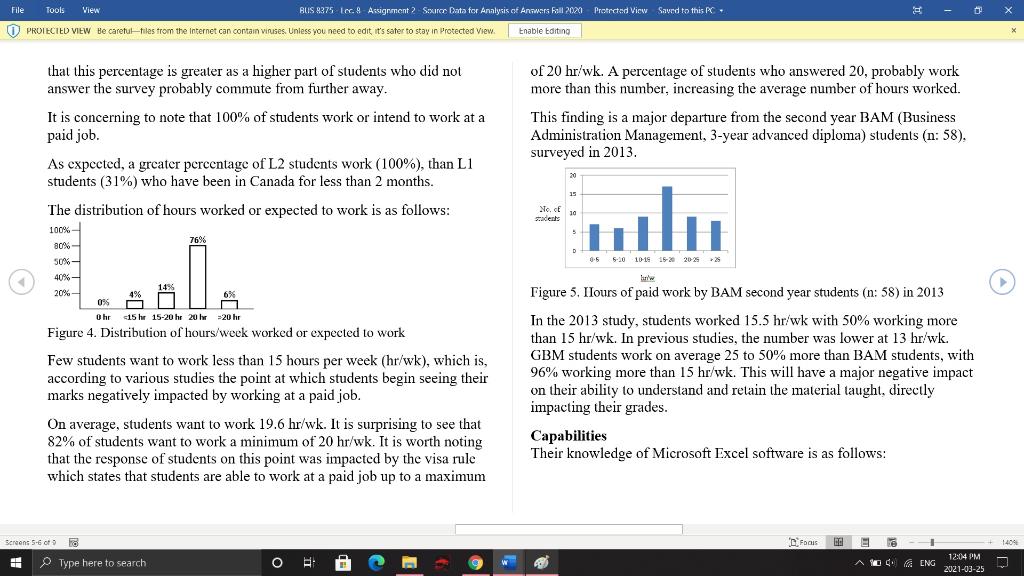
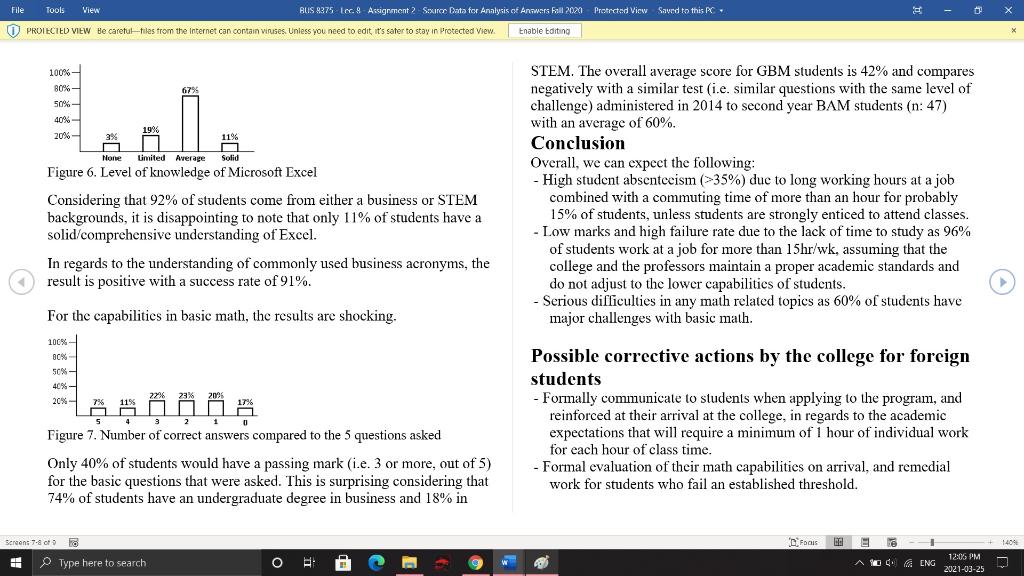
File Tools View BUS 8375 loc. 9 Assignment Source Data for Analysis of Antwers Fall 2020 Protected ViewSaved to this RC PROTECTED VIEW Be carefulfiles from the Internet can contain viruses. Unless you need to edit it's safer to stay in Protected view Enable Editing Data analysis from Winter 2019 survey of BUS8370 students - 91% of students are from a business or technical (STEM) background. - 100% of students want to work at a paid job. - 100% of L2 students currently work. - One-third of Level 1 students were working by week 6. - The level of 20 hr/wk of paid work is the actual or target number of hours for the vast majority of students. 22% of students have a limited or no knowledge of Excel when starting at the college, in spite of a 92% being from the business or STEM stream. - Understanding of business acronyms is good. - 60% of students got 0,1 or 2 good answers out 5 simple math questions. In spite of the time constraint, the result is poor. - An estimaled 15% of students have to commute a minimum of 1 hour each way Description As part of the redesign of course BUS8370, a survey was done to understand the background and capabilities of students taking the course. In weeks 5 and 6 of the Winter 2019 semester, students in 4 sections of BUS8370 were asked to complete a survey in class. Two versions of the written survey were created to minimize the potential collaboration between students of the same class. The class professors (2) administered the survey. Twenty (20) minutes were allocated for students to answer. The documents were then collected, with the analysis done in week Key points - 103 out of 182 registered students answered the questionnaire. Overall presence at 57% was low. Presence for students in their second or higher semester (L2) was 35%. - 40 out of 47 students in section 2 were at L2. Presence in class was 38% - At least 16% of students have been at Conestoga College for more than a year. This number is probably higher because of the high absence level (65%) of L2 students. Discussion Survey structure The survey was designed to obtain relatively quickly i.e. within 20 minutes), information on key elements that would be useful in understanding the background and capabilities of students. The survey was divided into 3 parts: Overall characterization of students - Assessing the understanding of common business terms - Assessing the abilities in math for percentage and ratio calculations. Seront 130 LFBA EL 1404 Type here to search Pi W 10 ENG 12:03 PM 2021-03-25 File Tools View BUS 8375 loc. 9 Assignment ? Soxerce Data for Analysis of Annwers Fall 2009 Protected ViewSaved to this RC PROTECTED VIEW Be carefulfiles from the Internet can contain viruses. Unless you need to edit it's safer to stay in Protected View Enable Editing that this percentage is greater as a higher part of students who did not answer the survey probably commute from further away. It is concerning to note that 100% of students work or intend to work at a paid job. As expected, a greater percentage of L2 students work (100%), than Li students (31%) who have been in Canada for less than 2 months. The distribution of hours worked or expected to work is as follows: of 20 hr/wk. A percentage of students who answered 20, probably work more than this number, increasing the average number of hours worked. This finding is a major departure from the second year BAM (Business Administration Management, 3-year advanced diploma) students (n: 58). surveyed in 2013. No. sadest ulu 100% 0-6 6-20 10-19 15-20 202 80% 50%- 40%- 20%- huw 0% Ohr HO Figure 4. Distribution of hours/week worked or expected to work Few students want to work less than 15 hours per week (hr/wk), which is, according to various studies the point at which students begin seeing their marks negatively impacted by working at a paid job. On average, students want to work 19.6 hr/wk. It is surprising to see that 82% of students want to work a minimum of 20 hr/wk. It is worth noting that the response of students on this point was impacted by the visa rule which states that students are able to work at a paid job up to a maximum Figure 5. Ilours of paid work by BAM second year students (n: 58) in 2013 In the 2013 study, students worked 15.5 hr/wk with 50% working more than 15 hr/wk. In previous studies, the number was lower at 13 hr/wk. GBM students work on average 25 to 50% more than BAM students, with 96% working more than 15 hr/wk. This will have a major negative impact on their ability to understand and retain the material taught, directly impacting their grades. Capabilities Their knowledge of Microsoft Excel software is as follows: Screens 5-6 of 9 DA EL 1404 Type here to search 10 ENG 12:04 PM 2021-03-25 File Tools View BUS 8375 loc. 9 Assignment ? Soxerce Data for Analysis of Annwers Fall 2009 Protected ViewSaved to this RC O PROTECTED VIEW Be caretul-files from the Internet can contain viruses. Unless you need to edit it's sater to stay in Protected View Enable taiting 100%- B0%- 50% 40%- 20%- 11% None Solid 2x Limited Average Figure 6. Level of knowledge of Microsoft Excel Considering that 92% of students come from either a business or STEM backgrounds, it is disappointing to note that only 11% of students have a solid/comprehensive understanding of Excel. In regards to the understanding of commonly used business acronyms, the result is positive with a success rate of 91%. STEM. The overall average score for GBM students is 42% and compares negatively with a similar test (i.e. similar questions with the same level of challenge) administered in 2014 to second year BAM students (n: 47) with an average of 60%. Conclusion Overall, we can expect the following: - High student absenteeism (>35%) due to long working hours at a job combined with a commuting time of more than an hour for probably 15% of students, unless students are strongly enticed to attend classes. - Low marks and high failure rate due to the lack of time to study as 96% of students work at a job for more than 15hr/wk, assuming that the college and the professors maintain a proper academic standards and do not adjust to the lower capabilities of students. - Serious difficulties in any math related topics as 60% of students have major challenges with basic math. For the capabilities in basic math, the results are shocking. 100% 80% 50%- 40%- 20%- 7% 11% 17% Possible corrective actions by the college for foreign students - Formally communicate to students when applying to the program, and reinforced at their arrival at the college, in regards to the academic expectations that will require a minimum of 1 hour of individual work for each hour of class time. - Formal evaluation of their math capabilities on arrival, and remedial work for students who fail an established threshold. Figure 7. Number of correct answers compared to the 5 questions asked Only 40% of students would have a passing mark (i.e. 3 or more, out of 5) for the basic questions that were asked. This is surprising considering that 74% of students have an undergraduate degree in business and 18% in Screen: 7-8 of 1 LFBA 140 Type here to search 10 ENG 12:06 PM 2021-03-25 File Tools View BUS 8375 loc. 9 Assignment Source Data for Analysis of Anawers Fall 2000 Protrcted ViewSaved to this PC- O PROTECTED VIEW Be caretul-files from the Internet can contain viruses. Unless you need to edit it's sater to stay in Protected View Enable taiting X I would like to thank Gary Zuliani and Nouman Siddiqui for their collaboration in administering the questionnaire. I would welcome feedback to improve this analysis in order to properly benefit from the results of this survey. Find met Screen ato DA EL 1401 Type here to search AO MENG 12:05 PM 2021-03-25 File Tools View BUS 8375 Asignment? Answer Sheet Instructions Winter 2001 Compatibility Mode Word Assignment 2 - Answer Sheet Analysis of a Questionnaire Name: Section no.: /10 This assignment is to critique the questionnaire administered to BUS8370 students in the GBM program in February 2019. The purpose was to ob- tain information in order to assist the redesign of the course to create a new course titled Business Research and Data Analysis. You will critique the design of the questionnaire. By using the material taught in this lecture, critique the questionnaire that was handed to you. Ensure that you are using the individual components discussed in the PowerPoint presentation. Use these components as a check list against which you are to analyse the approach, efficiency and reliability of the questionnaire. Note that all researchers critique their work so that the next time, they will create a better questionnaire. Please use the point form provided, where you will first write the component that you are analysing, followed by your observations. Read Mode Screen otro D Focus 1 Type here to search 10 ENG 12:11 PM 2021-03-25 File Tools View RUS 8375 Asignment? Answer Sheet Instruction: Winter 2001 Compatibility Mode Word NS End of cocument Screens 3-4 of 4 - 404 Type here to search A ENG 12:07 PM 2021-03-25 File Tools View BUS 8375 loc. 9 Assignment Source Data for Analysis of Antwers Fall 2020 Protected ViewSaved to this RC PROTECTED VIEW Be carefulfiles from the Internet can contain viruses. Unless you need to edit it's safer to stay in Protected view Enable Editing Data analysis from Winter 2019 survey of BUS8370 students - 91% of students are from a business or technical (STEM) background. - 100% of students want to work at a paid job. - 100% of L2 students currently work. - One-third of Level 1 students were working by week 6. - The level of 20 hr/wk of paid work is the actual or target number of hours for the vast majority of students. 22% of students have a limited or no knowledge of Excel when starting at the college, in spite of a 92% being from the business or STEM stream. - Understanding of business acronyms is good. - 60% of students got 0,1 or 2 good answers out 5 simple math questions. In spite of the time constraint, the result is poor. - An estimaled 15% of students have to commute a minimum of 1 hour each way Description As part of the redesign of course BUS8370, a survey was done to understand the background and capabilities of students taking the course. In weeks 5 and 6 of the Winter 2019 semester, students in 4 sections of BUS8370 were asked to complete a survey in class. Two versions of the written survey were created to minimize the potential collaboration between students of the same class. The class professors (2) administered the survey. Twenty (20) minutes were allocated for students to answer. The documents were then collected, with the analysis done in week Key points - 103 out of 182 registered students answered the questionnaire. Overall presence at 57% was low. Presence for students in their second or higher semester (L2) was 35%. - 40 out of 47 students in section 2 were at L2. Presence in class was 38% - At least 16% of students have been at Conestoga College for more than a year. This number is probably higher because of the high absence level (65%) of L2 students. Discussion Survey structure The survey was designed to obtain relatively quickly i.e. within 20 minutes), information on key elements that would be useful in understanding the background and capabilities of students. The survey was divided into 3 parts: Overall characterization of students - Assessing the understanding of common business terms - Assessing the abilities in math for percentage and ratio calculations. Seront 130 LFBA EL 1404 Type here to search Pi W 10 ENG 12:03 PM 2021-03-25 File Tools View BUS 8375 loc. 9 Assignment ? Soxerce Data for Analysis of Annwers Fall 2009 Protected ViewSaved to this RC PROTECTED VIEW Be carefulfiles from the Internet can contain viruses. Unless you need to edit it's safer to stay in Protected View Enable Editing that this percentage is greater as a higher part of students who did not answer the survey probably commute from further away. It is concerning to note that 100% of students work or intend to work at a paid job. As expected, a greater percentage of L2 students work (100%), than Li students (31%) who have been in Canada for less than 2 months. The distribution of hours worked or expected to work is as follows: of 20 hr/wk. A percentage of students who answered 20, probably work more than this number, increasing the average number of hours worked. This finding is a major departure from the second year BAM (Business Administration Management, 3-year advanced diploma) students (n: 58). surveyed in 2013. No. sadest ulu 100% 0-6 6-20 10-19 15-20 202 80% 50%- 40%- 20%- huw 0% Ohr HO Figure 4. Distribution of hours/week worked or expected to work Few students want to work less than 15 hours per week (hr/wk), which is, according to various studies the point at which students begin seeing their marks negatively impacted by working at a paid job. On average, students want to work 19.6 hr/wk. It is surprising to see that 82% of students want to work a minimum of 20 hr/wk. It is worth noting that the response of students on this point was impacted by the visa rule which states that students are able to work at a paid job up to a maximum Figure 5. Ilours of paid work by BAM second year students (n: 58) in 2013 In the 2013 study, students worked 15.5 hr/wk with 50% working more than 15 hr/wk. In previous studies, the number was lower at 13 hr/wk. GBM students work on average 25 to 50% more than BAM students, with 96% working more than 15 hr/wk. This will have a major negative impact on their ability to understand and retain the material taught, directly impacting their grades. Capabilities Their knowledge of Microsoft Excel software is as follows: Screens 5-6 of 9 DA EL 1404 Type here to search 10 ENG 12:04 PM 2021-03-25 File Tools View BUS 8375 loc. 9 Assignment ? Soxerce Data for Analysis of Annwers Fall 2009 Protected ViewSaved to this RC O PROTECTED VIEW Be caretul-files from the Internet can contain viruses. Unless you need to edit it's sater to stay in Protected View Enable taiting 100%- B0%- 50% 40%- 20%- 11% None Solid 2x Limited Average Figure 6. Level of knowledge of Microsoft Excel Considering that 92% of students come from either a business or STEM backgrounds, it is disappointing to note that only 11% of students have a solid/comprehensive understanding of Excel. In regards to the understanding of commonly used business acronyms, the result is positive with a success rate of 91%. STEM. The overall average score for GBM students is 42% and compares negatively with a similar test (i.e. similar questions with the same level of challenge) administered in 2014 to second year BAM students (n: 47) with an average of 60%. Conclusion Overall, we can expect the following: - High student absenteeism (>35%) due to long working hours at a job combined with a commuting time of more than an hour for probably 15% of students, unless students are strongly enticed to attend classes. - Low marks and high failure rate due to the lack of time to study as 96% of students work at a job for more than 15hr/wk, assuming that the college and the professors maintain a proper academic standards and do not adjust to the lower capabilities of students. - Serious difficulties in any math related topics as 60% of students have major challenges with basic math. For the capabilities in basic math, the results are shocking. 100% 80% 50%- 40%- 20%- 7% 11% 17% Possible corrective actions by the college for foreign students - Formally communicate to students when applying to the program, and reinforced at their arrival at the college, in regards to the academic expectations that will require a minimum of 1 hour of individual work for each hour of class time. - Formal evaluation of their math capabilities on arrival, and remedial work for students who fail an established threshold. Figure 7. Number of correct answers compared to the 5 questions asked Only 40% of students would have a passing mark (i.e. 3 or more, out of 5) for the basic questions that were asked. This is surprising considering that 74% of students have an undergraduate degree in business and 18% in Screen: 7-8 of 1 LFBA 140 Type here to search 10 ENG 12:06 PM 2021-03-25 File Tools View BUS 8375 loc. 9 Assignment Source Data for Analysis of Anawers Fall 2000 Protrcted ViewSaved to this PC- O PROTECTED VIEW Be caretul-files from the Internet can contain viruses. Unless you need to edit it's sater to stay in Protected View Enable taiting X I would like to thank Gary Zuliani and Nouman Siddiqui for their collaboration in administering the questionnaire. I would welcome feedback to improve this analysis in order to properly benefit from the results of this survey. Find met Screen ato DA EL 1401 Type here to search AO MENG 12:05 PM 2021-03-25 File Tools View BUS 8375 Asignment? Answer Sheet Instructions Winter 2001 Compatibility Mode Word Assignment 2 - Answer Sheet Analysis of a Questionnaire Name: Section no.: /10 This assignment is to critique the questionnaire administered to BUS8370 students in the GBM program in February 2019. The purpose was to ob- tain information in order to assist the redesign of the course to create a new course titled Business Research and Data Analysis. You will critique the design of the questionnaire. By using the material taught in this lecture, critique the questionnaire that was handed to you. Ensure that you are using the individual components discussed in the PowerPoint presentation. Use these components as a check list against which you are to analyse the approach, efficiency and reliability of the questionnaire. Note that all researchers critique their work so that the next time, they will create a better questionnaire. Please use the point form provided, where you will first write the component that you are analysing, followed by your observations. Read Mode Screen otro D Focus 1 Type here to search 10 ENG 12:11 PM 2021-03-25 File Tools View RUS 8375 Asignment? Answer Sheet Instruction: Winter 2001 Compatibility Mode Word NS End of cocument Screens 3-4 of 4 - 404 Type here to search A ENG 12:07 PM 2021-03-25Step by Step Solution
There are 3 Steps involved in it
1 Expert Approved Answer
Step: 1 Unlock

Question Has Been Solved by an Expert!
Get step-by-step solutions from verified subject matter experts
Step: 2 Unlock
Step: 3 Unlock