

Question: It's a project Topic can be anything as long as it falls under criteria, if unable to use stat crunch to generate graphs and what
It's a project
Topic can be anything as long as it falls under criteria, if unable to use stat crunch to generate graphs and what not information can be provided in table and I can convert data to graphs as needed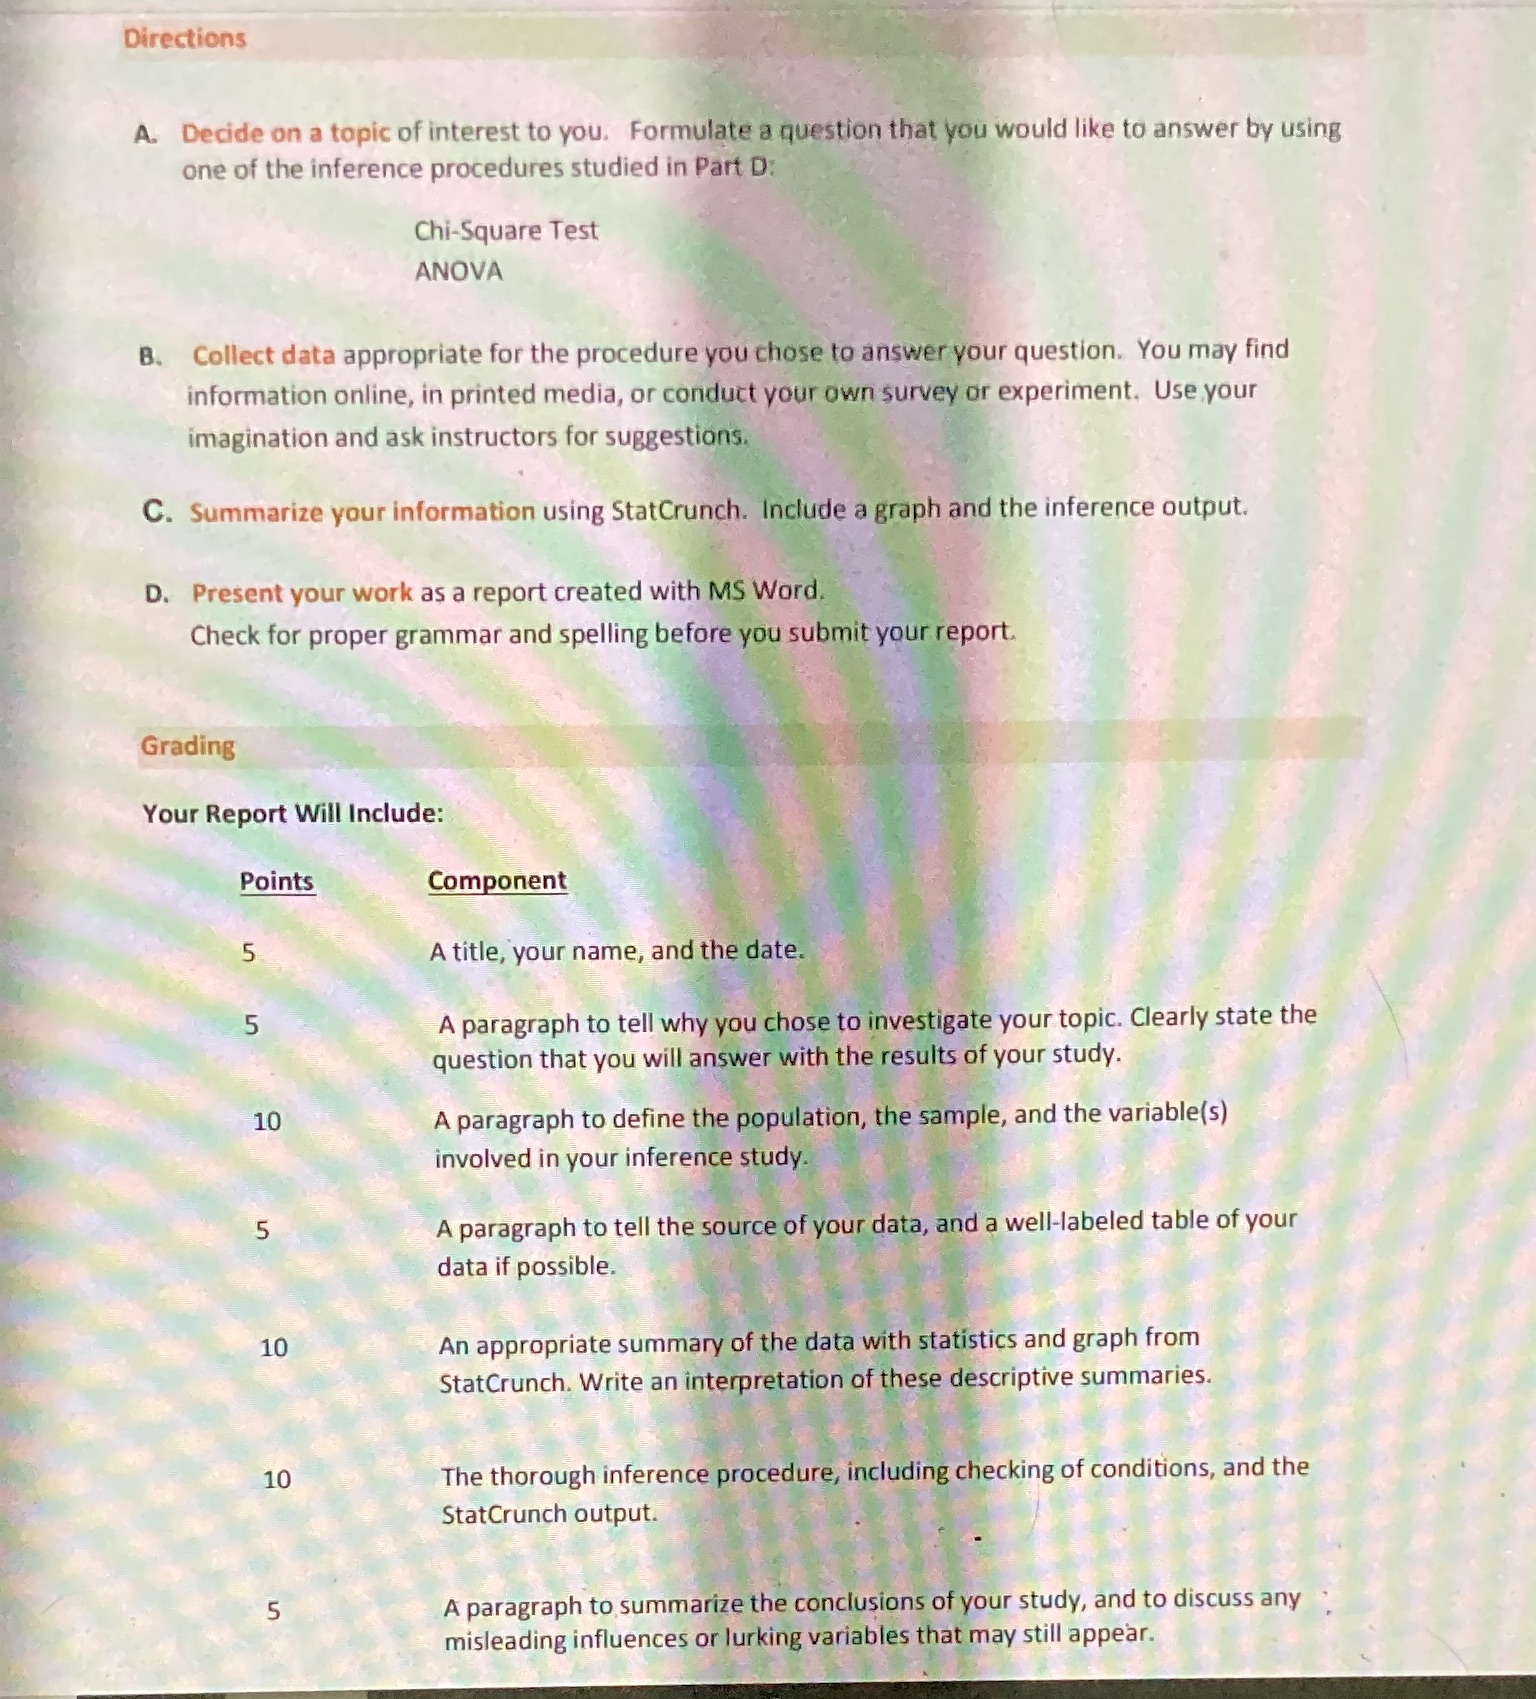 Directions A. Decide on a topic of interest to you. Formulate a question that you would like to answer by using one of the inference procedures studied in Part D: Chi-Square Test ANOVA B. Collect data appropriate for the procedure you chose to answer your question. You may find information online, in printed media, or conduct your own survey or experiment. Use your imagination and ask instructors for suggestions. C. Summarize your information using StatCrunch. Include a graph and the inference output. D. Present your work as a report created with MS Word. Check for proper grammar and spelling before you submit your report. Grading Your Report Will Include: Points Component 5 A title, your name, and the date. UT A paragraph to tell why you chose to investigate your topic. Clearly state the question that you will answer with the results of your study. 10 A paragraph to define the population, the sample, and the variable(s) involved in your inference study. unT A paragraph to tell the source of your data, and a well-labeled table of your data if possible. 10 An appropriate summary of the data with statistics and graph from StatCrunch. Write an interpretation of these descriptive summaries. 10 The thorough inference procedure, including checking of conditions, and the StatCrunch output. 5 A paragraph to summarize the conclusions of your study, and to discuss any misleading influences or lurking variables that may still appear
Step by Step Solution
There are 3 Steps involved in it

Get step-by-step solutions from verified subject matter experts