

Question: its all it has begin{tabular}{|ll|ll} hline 117 & & & fx end{tabular} begin{tabular}{|c|c|c|c|} hline hline A & B & C hline 1 & Oustomer
its all it has
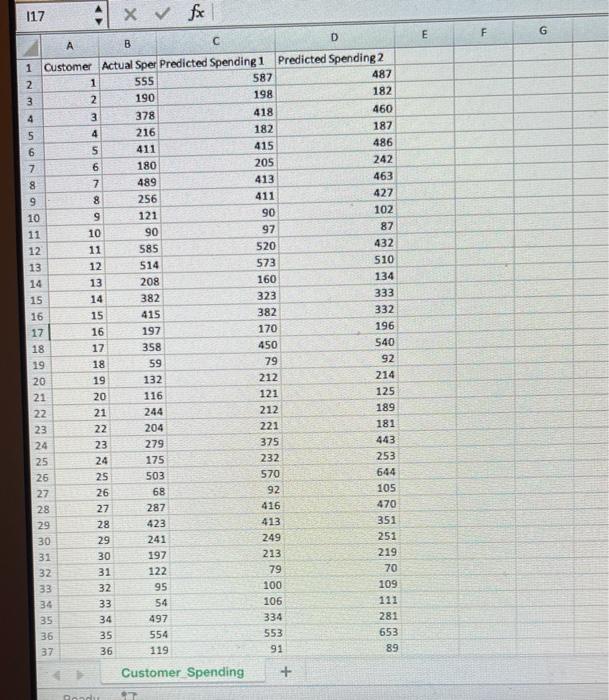
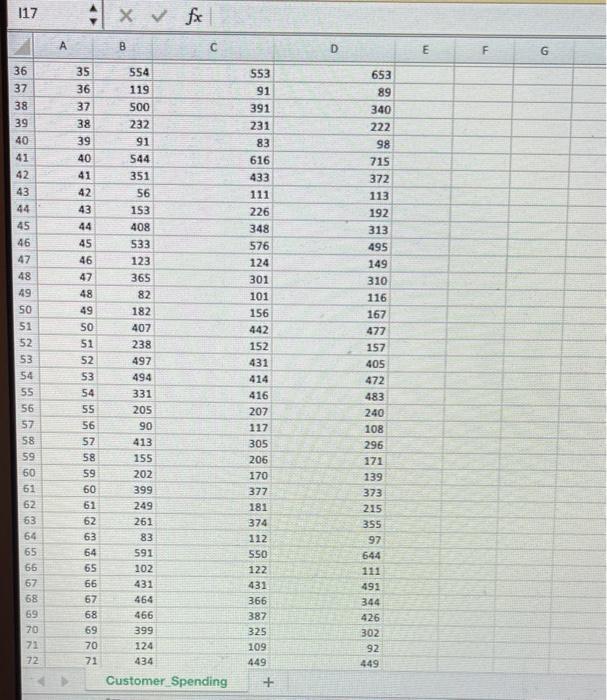
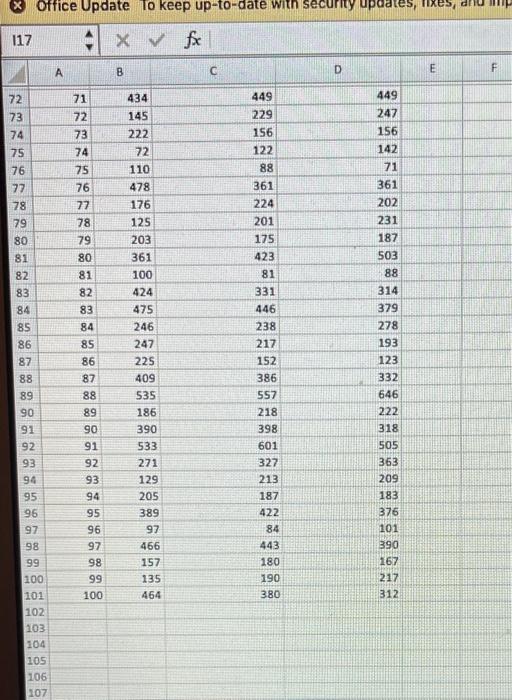
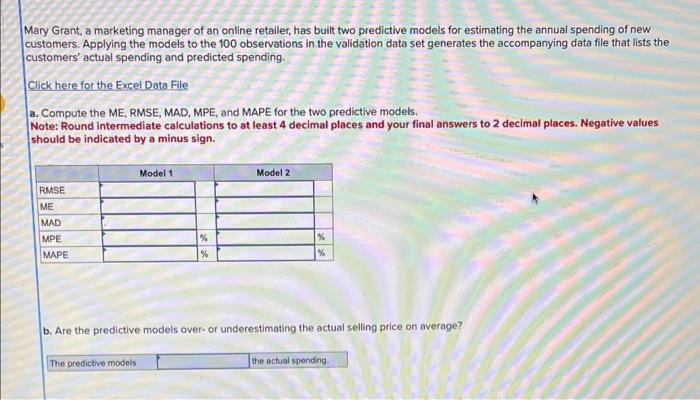
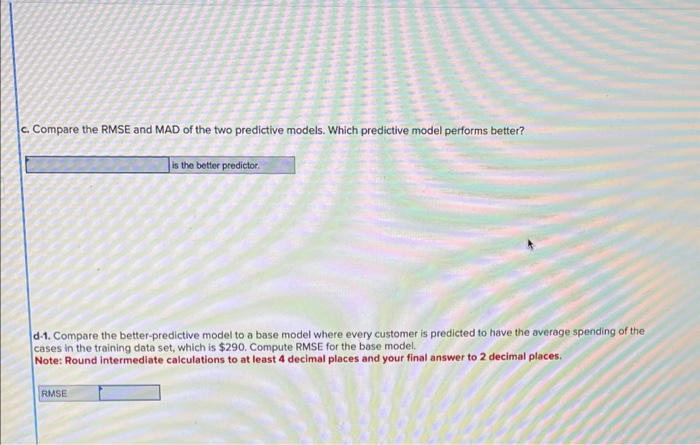
\begin{tabular}{|ll|ll} \hline 117 & & & fx \end{tabular} \begin{tabular}{|c|c|c|c|} \hline \hline A & B & C \\ \hline 1 & Oustomer & Actual Sper Predicted Spen \end{tabular} 1 Customer Actual Sper Predicted Spending 1 Predicted Spending 2 \begin{tabular}{|r|r|r|r|r|} \hline \hline & A & & & \\ \hline \end{tabular} lary Grant, a marketing manager of an online retailer, has built two predictive models for estimating the annual spending of new ustomers. Applying the models to the 100 observations in the validation data set generates the accompanying data file that lists the 'ustomers' actual spending and predicted spending. click here for the Excel Data File a. Compute the ME, RMSE, MAD, MPE, and MAPE for the two predictive models. Note: Round intermediate calculations to at least 4 decimal places and your final answers to 2 decimal places. Negative values should be indicated by a minus sign. b. Are the predictive models over- or underestimating the actual selling price on average? E. Compare the RMSE and MAD of the two predictive models. Which predictive model performs better? d-1. Compare the better-predictive model to a base model where every customer is predicted to have the average spending of the cases in the training data set, which is $290. Compute RMSE for the base model. Note: Round intermediate calculations to at least 4 decimal places and your final answer to 2 decimal places. d-2. Does the better-predictive model built by Mary outperform the base model in terms of RMSE? \begin{tabular}{|ll|ll} \hline 117 & & & fx \end{tabular} \begin{tabular}{|c|c|c|c|} \hline \hline A & B & C \\ \hline 1 & Oustomer & Actual Sper Predicted Spen \end{tabular} 1 Customer Actual Sper Predicted Spending 1 Predicted Spending 2 \begin{tabular}{|r|r|r|r|r|} \hline \hline & A & & & \\ \hline \end{tabular} lary Grant, a marketing manager of an online retailer, has built two predictive models for estimating the annual spending of new ustomers. Applying the models to the 100 observations in the validation data set generates the accompanying data file that lists the 'ustomers' actual spending and predicted spending. click here for the Excel Data File a. Compute the ME, RMSE, MAD, MPE, and MAPE for the two predictive models. Note: Round intermediate calculations to at least 4 decimal places and your final answers to 2 decimal places. Negative values should be indicated by a minus sign. b. Are the predictive models over- or underestimating the actual selling price on average? E. Compare the RMSE and MAD of the two predictive models. Which predictive model performs better? d-1. Compare the better-predictive model to a base model where every customer is predicted to have the average spending of the cases in the training data set, which is $290. Compute RMSE for the base model. Note: Round intermediate calculations to at least 4 decimal places and your final answer to 2 decimal places. d-2. Does the better-predictive model built by Mary outperform the base model in terms of RMSE
Step by Step Solution
There are 3 Steps involved in it
1 Expert Approved Answer
Step: 1 Unlock

Question Has Been Solved by an Expert!
Get step-by-step solutions from verified subject matter experts
Step: 2 Unlock
Step: 3 Unlock