

Question: its lengthy because you use the information below for it 1. (2 points) What was the expense that Cisco recorded on its 2014 income statement
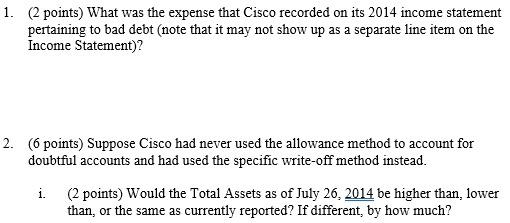
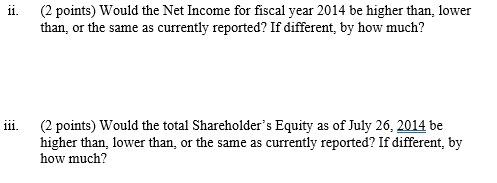
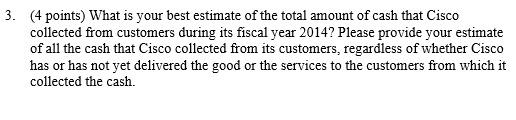
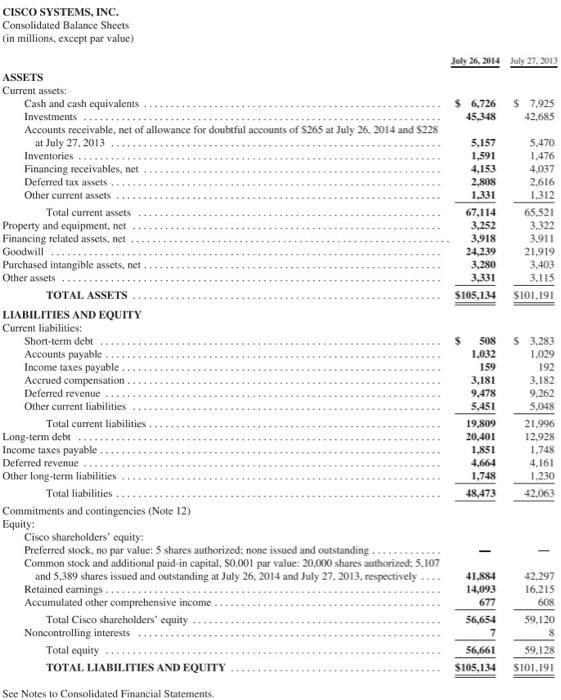
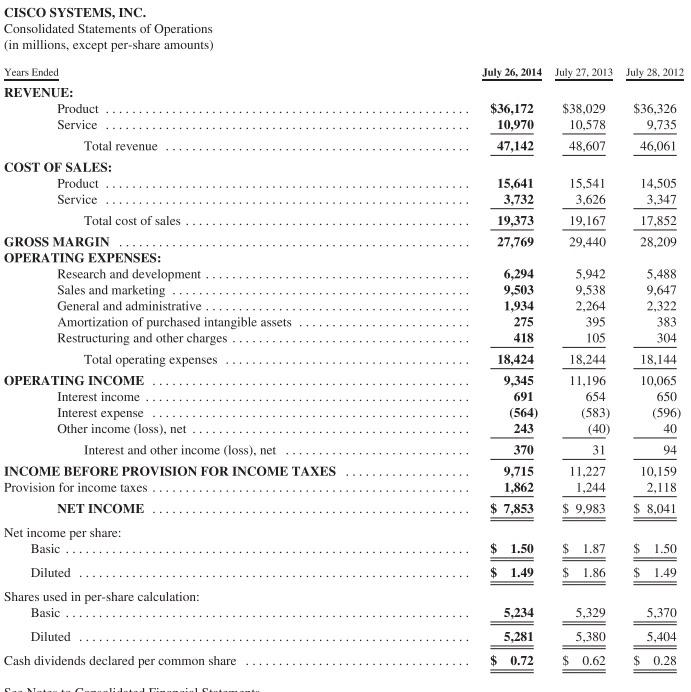
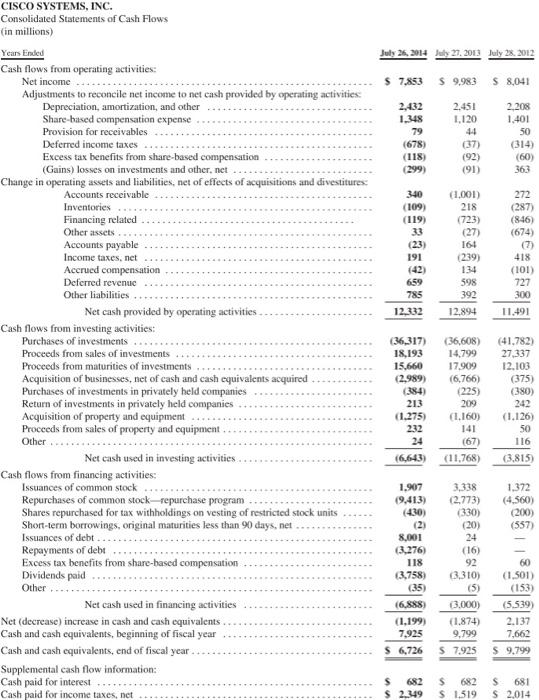
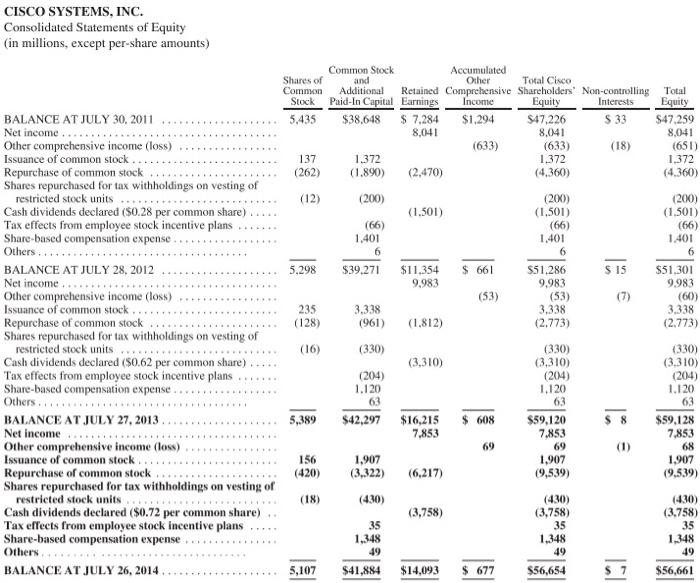
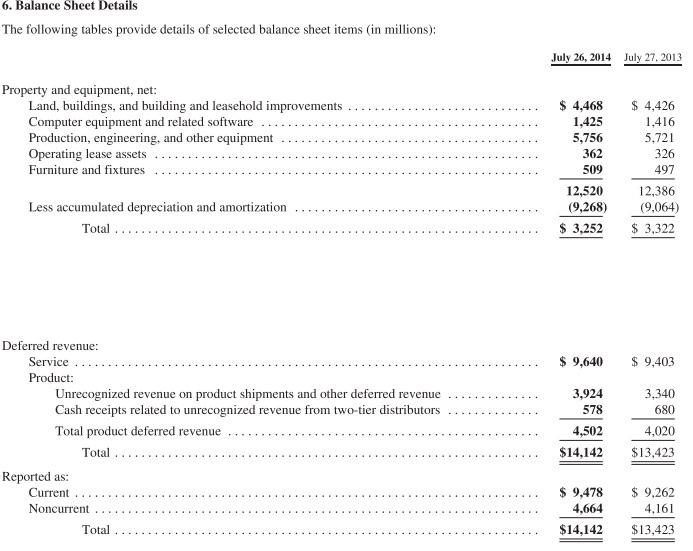
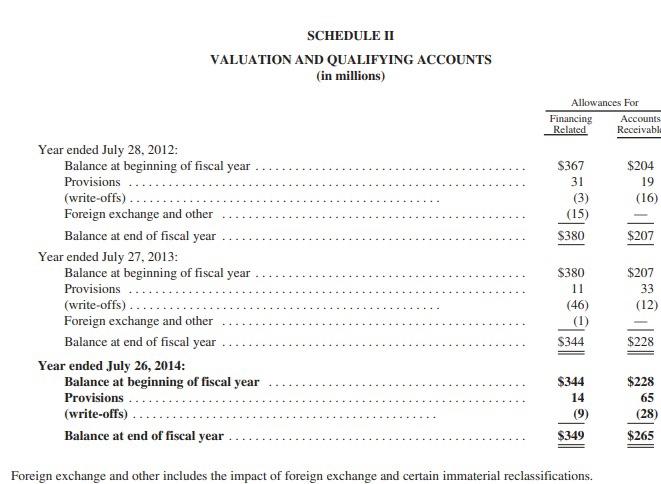
1. (2 points) What was the expense that Cisco recorded on its 2014 income statement pertaining to bad debt (note that it may not show up as a separate line item on the Income Statement)? 2. (6 points) Suppose Cisco had never used the allowance method to account for doubtful accounts and had used the specific write-off method instead. i. (2 points) Would the Total Assets as of July 26, 2014 be higher than, lower than, or the same as currently reported? If different, by how much? 11. 111. (2 points) Would the Net Income for fiscal year 2014 be higher than, lower than, or the same as currently reported? If different, by how much? (2 points) Would the total Shareholder's Equity as of July 26, 2014 be higher than, lower than, or the same as currently reported? If different, by how much? 3. (4 points) What is your best estimate of the total amount of cash that Cisco collected from customers during its fiscal year 2014? Please provide your estimate of all the cash that Cisco collected from its customers, regardless of whether Cisco has or has not yet delivered the good or the services to the customers from which it collected the cash. CISCO SYSTEMS, INC. Consolidated Balance Sheets (in millions, except par value) ASSETS Current assets: Cash and cash equivalents Investments Accounts receivable, net of allowance for doubtful accounts of $265 at July 26, 2014 and $228 at July 27, 2013 Inventories Financing receivables, net Deferred tax assets Other current assets... Total current assets Property and equipment, net Financing related assets, net Goodwill Purchased intangible assets, net. Other assets TOTAL ASSETS LIABILITIES AND EQUITY Current liabilities: Short-term debt Accounts payable Income taxes payable. Accrued compensation. Deferred revenue Other current liabilities Total current liabilities Long-term debt Income taxes payable Deferred revenue Other long-term liabilities Total liabilities Commitments and contingencies (Note 12) Equity: Cisco shareholders' equity: Preferred stock, no par value: 5 shares authorized: none issued and outstanding. Common stock and additional paid-in capital, $0.001 par value: 20,000 shares authorized: 5.107 and 5,389 shares issued and outstanding at July 26, 2014 and July 27, 2013, respectively Retained earnings. Accumulated other comprehensive income. Total Cisco shareholders' equity Noncontrolling interests Total equity TOTAL LIABILITIES AND EQUITY See Notes to Consolidated Financial Statements. July 26, 2014 July 27, 2013 $ 6,726 45,348 5,157 1,591 4,153 2,808 1,331 67,114 3,252 3,918 24,239 3,280 3,331 $105,134 $ 508 1,032 159 3,181 9,478 5,451 19,809 20,401 1,851 4,664 1,748 48,473 41,884 14,093 677 56,654 7 $ 7,925 42,685 5.470 1,476 4,037 2,616 1,312 65,521 3.322 3.911 21,919 3,403 3,115 $101,191 S 3,283 1,029 192 3,182 9,262 5,048 21.996 12,928 1,748 4,161 1,230 42,063 T 42,297 16,215 608 59,120 56,661 39,128 $105,134 $101,191 CISCO SYSTEMS, INC. Consolidated Statements of Operations (in millions, except per-share amounts) Years Ended REVENUE: Product Service Total revenue COST OF SALES: Product Service Total cost of sales GROSS MARGIN OPERATING EXPENSES: Research and development. Sales and marketing General and administrative. Amortization of purchased intangible assets Restructuring and other charges. Total operating expenses OPERATING INCOME Interest income Interest expense Other income (loss), net Interest and other income (loss), net INCOME BEFORE PROVISION FOR INCOME TAXES Provision for income taxes NET INCOME Net income per share: Basic... Diluted Shares used in per-share calculation: Basic. Diluted Cash dividends declared per common share T July 26, 2014 July 27, 2013 July 28, 2012 $36,172 10,970 47,142 15,641 15,541 3,732 3,626 19,373 19,167 27,769 29,440 6,294 9,503 1,934 275 418 18,424 9,345 691 (564) 243 370 9,715 1,862 $ 7,853 $ 1.50 $1.49 $38,029 10,578 48,607 5,234 5,281 $ 0.72 5,942 9,538 2,264 395 105 18,244 11,196 654 (583) (40) 31 11,227 1,244 $ 9,983 $ 1.87 $ 1.86 5,329 5,380 $ 0.62 $36,326 9,735 46,061 14,505 3,347 17,852 28,209 5,488 9,647 2,322 383 304 18,144 10,065 650 (596) 40 94 10,159 2,118 $ 8,041 $ 1.50 $ 1.49 5,370 5,404 $ 0.28 CISCO SYSTEMS, INC. Consolidated Statements of Cash Flows (in millions) Years Ended Cash flows from operating activities: Net income Adjustments to reconcile net income to net cash provided by operating activities: Depreciation, amortization, and other Share-based compensation expense Provision for receivables Deferred income taxes Excess tax benefits from share-based compensation (Gains) losses on investments and other, net Change in operating assets and liabilities, net of effects of acquisitions and divestitures: Accounts receivable Inventories Financing related Other assets Accounts payable Income taxes, net Accrued compensation Deferred revenue Other liabilities. Net cash provided by operating activities. Cash flows from investing activities: Purchases of investments Proceeds from sales of investments Proceeds from maturities of investments... Acquisition of businesses, net of cash and cash equivalents acquired Purchases of investments in privately held companies Return of investments in privately held companies Acquisition of property and equipment Proceeds from sales of property and equipment Other Net cash used in investing activities Cash flows from financing activities: Issuances of common stock Repurchases of common stock-repurchase program Shares repurchased for tax withholdings on vesting of restricted stock units Short-term borrowings, original maturities less than 90 days, net Issuances of debt... Repayments of debt Excess tax benefits from share-based compensation Dividends paid Other Net cash used in financing activities Net (decrease) increase in cash and cash equivalents. Cash and cash equivalents, beginning of fiscal year Cash and cash equivalents, end of fiscal year Supplemental cash flow information: Cash paid for interest Cash paid for income taxes, net July 26, 2014 July 27, 2013 July 28, 2012 $ 7,853 2,432 1,348 79 (678) (118) (299) 340 (109) (119) 33 (23) 191 (42) 659 785 12,332 (384) 213 (1,275) 232 24 | (6,643) (36,317) (36,608) 18,193 14,799 15,660 17,909 (2,989) (6,766) 1,907 (9,413) (430) (2) 8,001 (3,276) 118 (3,758) (35) (6,888) (1,199) 7,925 $ 6,726 $ 9,983 $ 682 $ 2,349 2,451 1,120 44 (37) (92) (91) (1,001) 218 (723) (27) 164 (239) 134 598 392 12,894 (225) 209 (1,160) 141 (67) (11,768) 3,338 (2,773) (330) (20) 24 (16) 92 (3,310) (5) (3,000) (1,874) 9,799 $ 7.925 $ 682 $ 1,519 $ 8,041 2,208 1,401 50 (314) (60) 363 272 (287) (846) (674) (7) 418 (101) 727 300 11.491 (41,782) 27,337 12.103 (375) (380) 242 (1.126) 50 116 (3,815) 1,372 (4,560) (200) (557) 60 (1.501) (153) (5.539) 2.137 7,662 $ 9,799 S 681 $ 2,014 CISCO SYSTEMS, INC. Consolidated Statements of Equity (in millions, except per-share amounts) BALANCE AT JULY 30, 2011 Net income.. Other comprehensive income (loss) Issuance of common stock Repurchase of common stock Shares repurchased for tax withholdings on vesting of restricted stock units Cash dividends declared ($0.28 per common share) Tax effects from employee stock incentive plans Share-based compensation expense.. Others..... BALANCE AT JULY 28, 2012 Net income. Other comprehensive income (loss) Issuance of common stock. Repurchase of common stock Shares repurchased for tax withholdings on vesting of restricted stock units ****** Cash dividends declared ($0.62 per common share) Tax effects from employee stock incentive plans Share-based compensation expense... Others... BALANCE AT JULY 27, 2013. Net income Other comprehensive income (loss) Issuance of common stock. ********** *********** Repurchase of common stock Shares repurchased for tax withholdings on vesting of restricted stock units ******* Cash dividends declared ($0.72 per common share) Tax effects from employee stock incentive plans Share-based compensation expense Others BALANCE AT JULY 26, 2014. ******* PAYA Shares of Common Stock 5,435 137 (262) (12) 5,298 235 (128) (16) 5,389 156 (420) (18) 5,107 Common Stock Accumulated Other and Total Cisco Additional Retained Comprehensive Shareholders' Non-controlling Total Paid-In Capital Earnings Income Equity Interests Equity $1.294 $33 (633) (18) $38,648 $ 7,284 8,041 1.372 (1,890) (200) (66) 1,401 6 $39,271 3,338 (961) (330) (204) 1,120 63 $42,297 1,907 (3,322) (430) 35 1,348 49 (2,470) (1,501) $11,354 9,983 (1,812) (3,310) $16,215 7,853 (6,217) (3,758) $41,884 $14,093 $ 661 (53) $ 608 69 $ 677 $47,226 8,041 (633) 1,372 (4,360) (200) (1,501) (66) 1,401 6 $51,286 9,983 (53) 3,338 (2.773) (330) (3,310) (204) 1,120 63 $59,120 7,853 69 1,907 (9,539) (430) (3,758) 35 1,348 49 $56,654 $ 15 (7) $47,259 8,041 (651) 1,372 (4,360) (200) (1,501) (66) 1.401 6 $51,301 9.983 (60) 3,338 (2,773) (330) (3,310) (204) 1.120 63 $59,128 7,853 68 1,907 (9,539) (430) (3,758) 35 1,348 49 $56,661 6. Balance Sheet Details The following tables provide details of selected balance sheet items (in millions): Property and equipment, net: Land, buildings, and building and leasehold improvements Computer equipment and related software Production, engineering, and other equipment Operating lease assets Furniture and fixtures Less accumulated depreciation and amortization Total.. Deferred revenue: Service Product: Unrecognized revenue on product shipments and other deferred revenue Cash receipts related to unrecognized revenue from two-tier distributors Total product deferred revenue Total Reported as: Current Noncurrent Total July 26, 2014 July 27, 2013 $ 4,468 1,425 5,756 362 509 12,520 (9,268) $3,252 $ 9,640 3,924 578 4,502 $14,142 $ 4,426 1,416 5,721 326 497 12,386 (9,064) $ 3,322 $ 9,403 3,340 680 4,020 $13,423 $ 9,262 4,161 $ 9,478 4,664 $14,142 $13,423 Year ended July 28, 2012: Balance at beginning of fiscal year Provisions (write-offs).. SCHEDULE II VALUATION AND QUALIFYING ACCOUNTS (in millions) Foreign exchange and other Balance at end of fiscal year Year ended July 27, 2013: Balance at beginning of fiscal year Provisions (write-offs). Foreign exchange and other Balance at end of fiscal year Year ended July 26, 2014: Allowances For Financing Accounts Related Receivabla $367 31 (3) (15) $380 $380 11 (46) (1) $344 Balance at beginning of fiscal year Provisions (write-offs) Balance at end of fiscal year Foreign exchange and other includes the impact of foreign exchange and certain immaterial reclassifications. $344 14 (9) $349 $204 19 (16) $207 $207 33 (12) $228 $228 65 (28) $265 1. (2 points) What was the expense that Cisco recorded on its 2014 income statement pertaining to bad debt (note that it may not show up as a separate line item on the Income Statement)? 2. (6 points) Suppose Cisco had never used the allowance method to account for doubtful accounts and had used the specific write-off method instead. i. (2 points) Would the Total Assets as of July 26, 2014 be higher than, lower than, or the same as currently reported? If different, by how much? 11. 111. (2 points) Would the Net Income for fiscal year 2014 be higher than, lower than, or the same as currently reported? If different, by how much? (2 points) Would the total Shareholder's Equity as of July 26, 2014 be higher than, lower than, or the same as currently reported? If different, by how much? 3. (4 points) What is your best estimate of the total amount of cash that Cisco collected from customers during its fiscal year 2014? Please provide your estimate of all the cash that Cisco collected from its customers, regardless of whether Cisco has or has not yet delivered the good or the services to the customers from which it collected the cash. CISCO SYSTEMS, INC. Consolidated Balance Sheets (in millions, except par value) ASSETS Current assets: Cash and cash equivalents Investments Accounts receivable, net of allowance for doubtful accounts of $265 at July 26, 2014 and $228 at July 27, 2013 Inventories Financing receivables, net Deferred tax assets Other current assets... Total current assets Property and equipment, net Financing related assets, net Goodwill Purchased intangible assets, net. Other assets TOTAL ASSETS LIABILITIES AND EQUITY Current liabilities: Short-term debt Accounts payable Income taxes payable. Accrued compensation. Deferred revenue Other current liabilities Total current liabilities Long-term debt Income taxes payable Deferred revenue Other long-term liabilities Total liabilities Commitments and contingencies (Note 12) Equity: Cisco shareholders' equity: Preferred stock, no par value: 5 shares authorized: none issued and outstanding. Common stock and additional paid-in capital, $0.001 par value: 20,000 shares authorized: 5.107 and 5,389 shares issued and outstanding at July 26, 2014 and July 27, 2013, respectively Retained earnings. Accumulated other comprehensive income. Total Cisco shareholders' equity Noncontrolling interests Total equity TOTAL LIABILITIES AND EQUITY See Notes to Consolidated Financial Statements. July 26, 2014 July 27, 2013 $ 6,726 45,348 5,157 1,591 4,153 2,808 1,331 67,114 3,252 3,918 24,239 3,280 3,331 $105,134 $ 508 1,032 159 3,181 9,478 5,451 19,809 20,401 1,851 4,664 1,748 48,473 41,884 14,093 677 56,654 7 $ 7,925 42,685 5.470 1,476 4,037 2,616 1,312 65,521 3.322 3.911 21,919 3,403 3,115 $101,191 S 3,283 1,029 192 3,182 9,262 5,048 21.996 12,928 1,748 4,161 1,230 42,063 T 42,297 16,215 608 59,120 56,661 39,128 $105,134 $101,191 CISCO SYSTEMS, INC. Consolidated Statements of Operations (in millions, except per-share amounts) Years Ended REVENUE: Product Service Total revenue COST OF SALES: Product Service Total cost of sales GROSS MARGIN OPERATING EXPENSES: Research and development. Sales and marketing General and administrative. Amortization of purchased intangible assets Restructuring and other charges. Total operating expenses OPERATING INCOME Interest income Interest expense Other income (loss), net Interest and other income (loss), net INCOME BEFORE PROVISION FOR INCOME TAXES Provision for income taxes NET INCOME Net income per share: Basic... Diluted Shares used in per-share calculation: Basic. Diluted Cash dividends declared per common share T July 26, 2014 July 27, 2013 July 28, 2012 $36,172 10,970 47,142 15,641 15,541 3,732 3,626 19,373 19,167 27,769 29,440 6,294 9,503 1,934 275 418 18,424 9,345 691 (564) 243 370 9,715 1,862 $ 7,853 $ 1.50 $1.49 $38,029 10,578 48,607 5,234 5,281 $ 0.72 5,942 9,538 2,264 395 105 18,244 11,196 654 (583) (40) 31 11,227 1,244 $ 9,983 $ 1.87 $ 1.86 5,329 5,380 $ 0.62 $36,326 9,735 46,061 14,505 3,347 17,852 28,209 5,488 9,647 2,322 383 304 18,144 10,065 650 (596) 40 94 10,159 2,118 $ 8,041 $ 1.50 $ 1.49 5,370 5,404 $ 0.28 CISCO SYSTEMS, INC. Consolidated Statements of Cash Flows (in millions) Years Ended Cash flows from operating activities: Net income Adjustments to reconcile net income to net cash provided by operating activities: Depreciation, amortization, and other Share-based compensation expense Provision for receivables Deferred income taxes Excess tax benefits from share-based compensation (Gains) losses on investments and other, net Change in operating assets and liabilities, net of effects of acquisitions and divestitures: Accounts receivable Inventories Financing related Other assets Accounts payable Income taxes, net Accrued compensation Deferred revenue Other liabilities. Net cash provided by operating activities. Cash flows from investing activities: Purchases of investments Proceeds from sales of investments Proceeds from maturities of investments... Acquisition of businesses, net of cash and cash equivalents acquired Purchases of investments in privately held companies Return of investments in privately held companies Acquisition of property and equipment Proceeds from sales of property and equipment Other Net cash used in investing activities Cash flows from financing activities: Issuances of common stock Repurchases of common stock-repurchase program Shares repurchased for tax withholdings on vesting of restricted stock units Short-term borrowings, original maturities less than 90 days, net Issuances of debt... Repayments of debt Excess tax benefits from share-based compensation Dividends paid Other Net cash used in financing activities Net (decrease) increase in cash and cash equivalents. Cash and cash equivalents, beginning of fiscal year Cash and cash equivalents, end of fiscal year Supplemental cash flow information: Cash paid for interest Cash paid for income taxes, net July 26, 2014 July 27, 2013 July 28, 2012 $ 7,853 2,432 1,348 79 (678) (118) (299) 340 (109) (119) 33 (23) 191 (42) 659 785 12,332 (384) 213 (1,275) 232 24 | (6,643) (36,317) (36,608) 18,193 14,799 15,660 17,909 (2,989) (6,766) 1,907 (9,413) (430) (2) 8,001 (3,276) 118 (3,758) (35) (6,888) (1,199) 7,925 $ 6,726 $ 9,983 $ 682 $ 2,349 2,451 1,120 44 (37) (92) (91) (1,001) 218 (723) (27) 164 (239) 134 598 392 12,894 (225) 209 (1,160) 141 (67) (11,768) 3,338 (2,773) (330) (20) 24 (16) 92 (3,310) (5) (3,000) (1,874) 9,799 $ 7.925 $ 682 $ 1,519 $ 8,041 2,208 1,401 50 (314) (60) 363 272 (287) (846) (674) (7) 418 (101) 727 300 11.491 (41,782) 27,337 12.103 (375) (380) 242 (1.126) 50 116 (3,815) 1,372 (4,560) (200) (557) 60 (1.501) (153) (5.539) 2.137 7,662 $ 9,799 S 681 $ 2,014 CISCO SYSTEMS, INC. Consolidated Statements of Equity (in millions, except per-share amounts) BALANCE AT JULY 30, 2011 Net income.. Other comprehensive income (loss) Issuance of common stock Repurchase of common stock Shares repurchased for tax withholdings on vesting of restricted stock units Cash dividends declared ($0.28 per common share) Tax effects from employee stock incentive plans Share-based compensation expense.. Others..... BALANCE AT JULY 28, 2012 Net income. Other comprehensive income (loss) Issuance of common stock. Repurchase of common stock Shares repurchased for tax withholdings on vesting of restricted stock units ****** Cash dividends declared ($0.62 per common share) Tax effects from employee stock incentive plans Share-based compensation expense... Others... BALANCE AT JULY 27, 2013. Net income Other comprehensive income (loss) Issuance of common stock. ********** *********** Repurchase of common stock Shares repurchased for tax withholdings on vesting of restricted stock units ******* Cash dividends declared ($0.72 per common share) Tax effects from employee stock incentive plans Share-based compensation expense Others BALANCE AT JULY 26, 2014. ******* PAYA Shares of Common Stock 5,435 137 (262) (12) 5,298 235 (128) (16) 5,389 156 (420) (18) 5,107 Common Stock Accumulated Other and Total Cisco Additional Retained Comprehensive Shareholders' Non-controlling Total Paid-In Capital Earnings Income Equity Interests Equity $1.294 $33 (633) (18) $38,648 $ 7,284 8,041 1.372 (1,890) (200) (66) 1,401 6 $39,271 3,338 (961) (330) (204) 1,120 63 $42,297 1,907 (3,322) (430) 35 1,348 49 (2,470) (1,501) $11,354 9,983 (1,812) (3,310) $16,215 7,853 (6,217) (3,758) $41,884 $14,093 $ 661 (53) $ 608 69 $ 677 $47,226 8,041 (633) 1,372 (4,360) (200) (1,501) (66) 1,401 6 $51,286 9,983 (53) 3,338 (2.773) (330) (3,310) (204) 1,120 63 $59,120 7,853 69 1,907 (9,539) (430) (3,758) 35 1,348 49 $56,654 $ 15 (7) $47,259 8,041 (651) 1,372 (4,360) (200) (1,501) (66) 1.401 6 $51,301 9.983 (60) 3,338 (2,773) (330) (3,310) (204) 1.120 63 $59,128 7,853 68 1,907 (9,539) (430) (3,758) 35 1,348 49 $56,661 6. Balance Sheet Details The following tables provide details of selected balance sheet items (in millions): Property and equipment, net: Land, buildings, and building and leasehold improvements Computer equipment and related software Production, engineering, and other equipment Operating lease assets Furniture and fixtures Less accumulated depreciation and amortization Total.. Deferred revenue: Service Product: Unrecognized revenue on product shipments and other deferred revenue Cash receipts related to unrecognized revenue from two-tier distributors Total product deferred revenue Total Reported as: Current Noncurrent Total July 26, 2014 July 27, 2013 $ 4,468 1,425 5,756 362 509 12,520 (9,268) $3,252 $ 9,640 3,924 578 4,502 $14,142 $ 4,426 1,416 5,721 326 497 12,386 (9,064) $ 3,322 $ 9,403 3,340 680 4,020 $13,423 $ 9,262 4,161 $ 9,478 4,664 $14,142 $13,423 Year ended July 28, 2012: Balance at beginning of fiscal year Provisions (write-offs).. SCHEDULE II VALUATION AND QUALIFYING ACCOUNTS (in millions) Foreign exchange and other Balance at end of fiscal year Year ended July 27, 2013: Balance at beginning of fiscal year Provisions (write-offs). Foreign exchange and other Balance at end of fiscal year Year ended July 26, 2014: Allowances For Financing Accounts Related Receivabla $367 31 (3) (15) $380 $380 11 (46) (1) $344 Balance at beginning of fiscal year Provisions (write-offs) Balance at end of fiscal year Foreign exchange and other includes the impact of foreign exchange and certain immaterial reclassifications. $344 14 (9) $349 $204 19 (16) $207 $207 33 (12) $228 $228 65 (28) $265
Step by Step Solution
There are 3 Steps involved in it

Get step-by-step solutions from verified subject matter experts