Question: It's more than one question but all tie together so it's impossible to post the questions separate. Need help understanding since its an online class.
It's more than one question but all tie together so it's impossible to post the questions separate. Need help understanding since its an online class. Thanks in advance feel free to somehow break it up in more parts manually if possible just need help. Thanks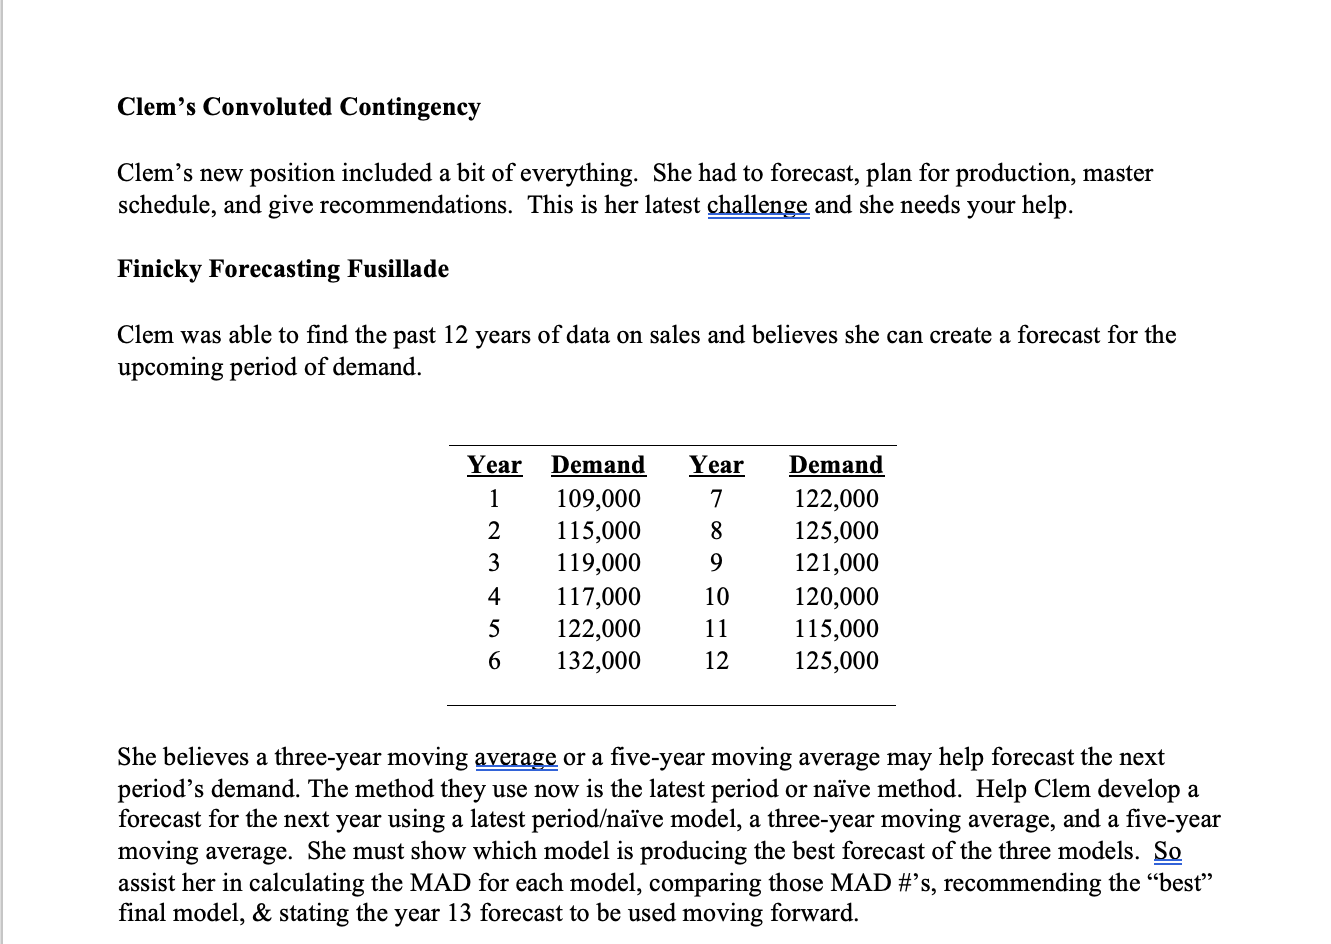
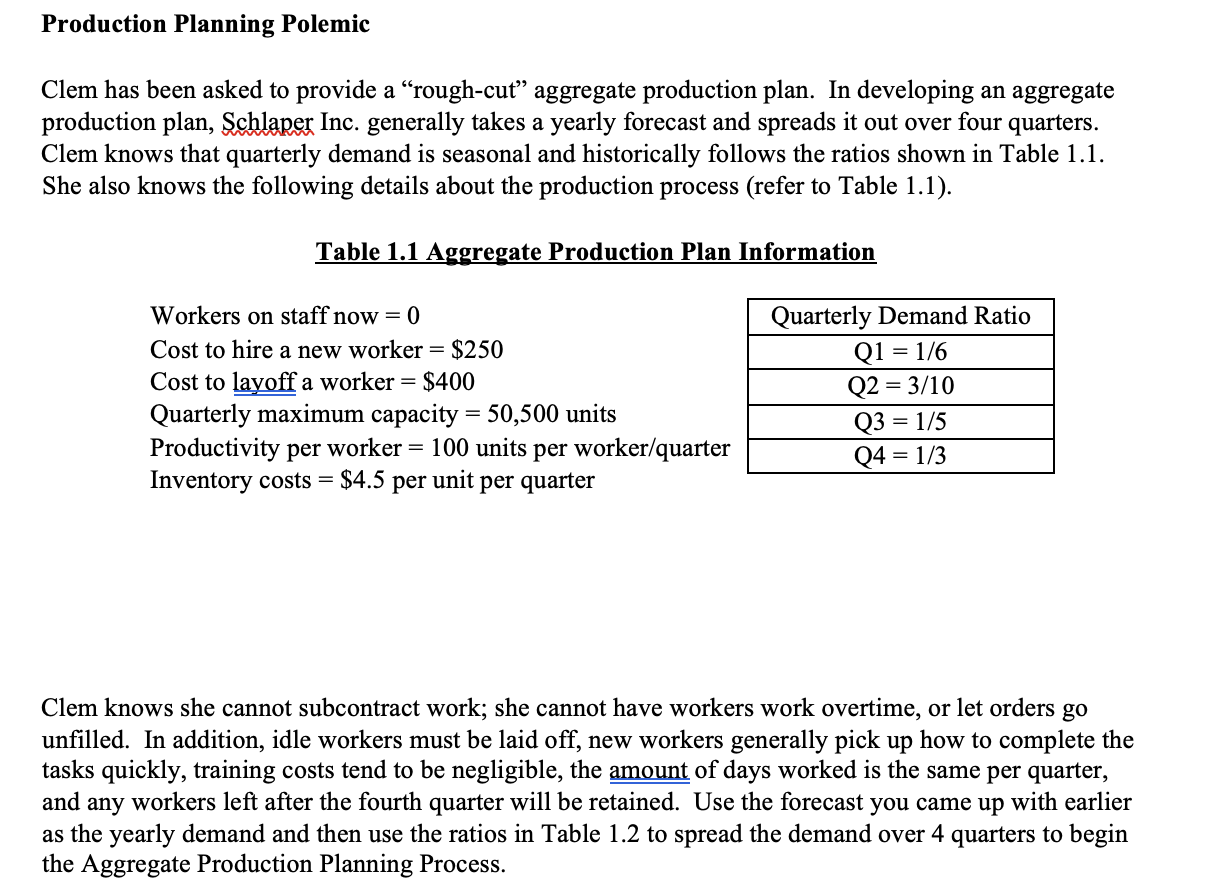
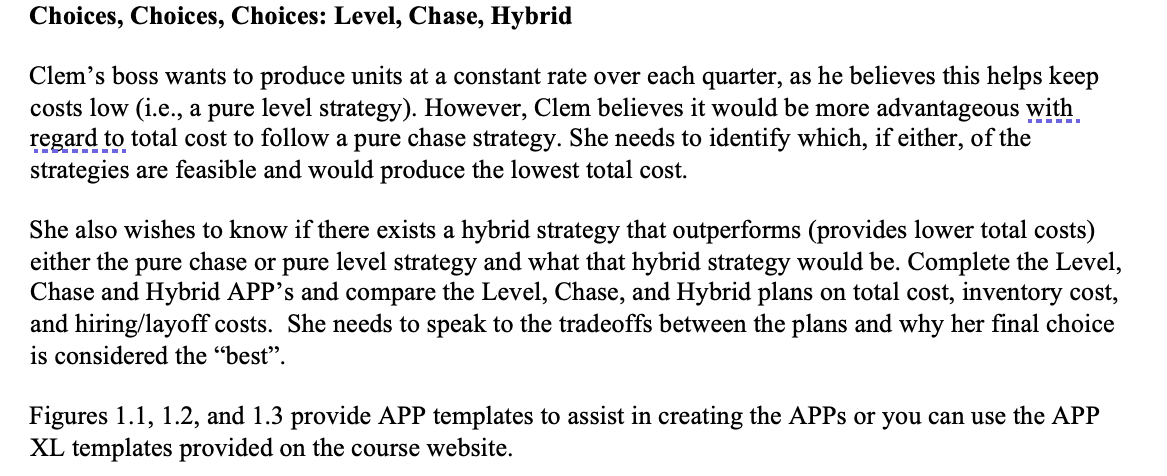
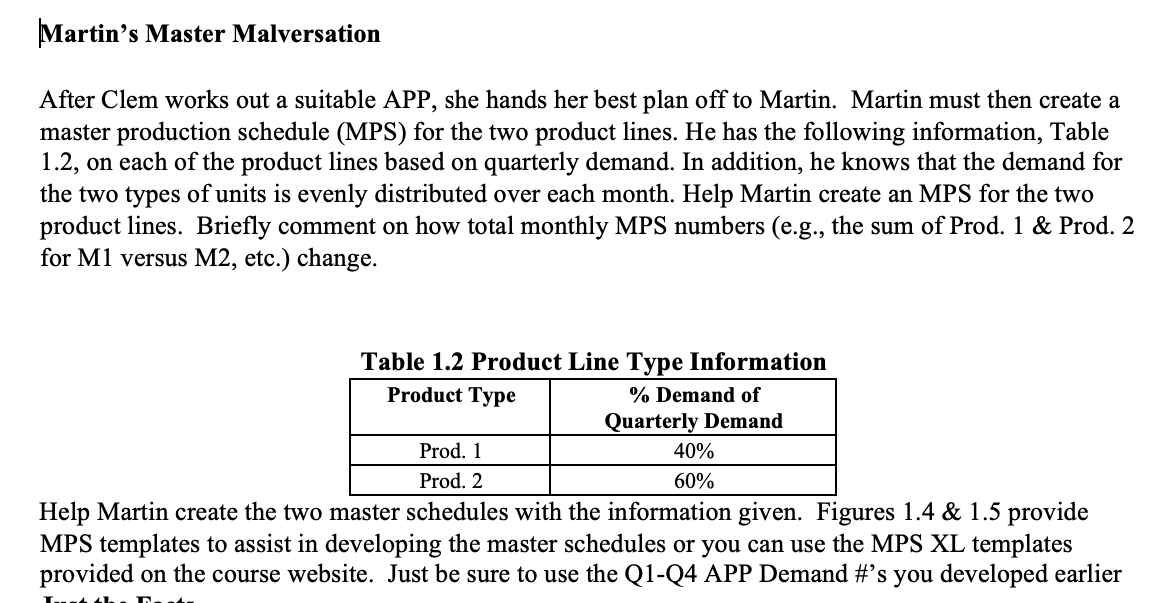
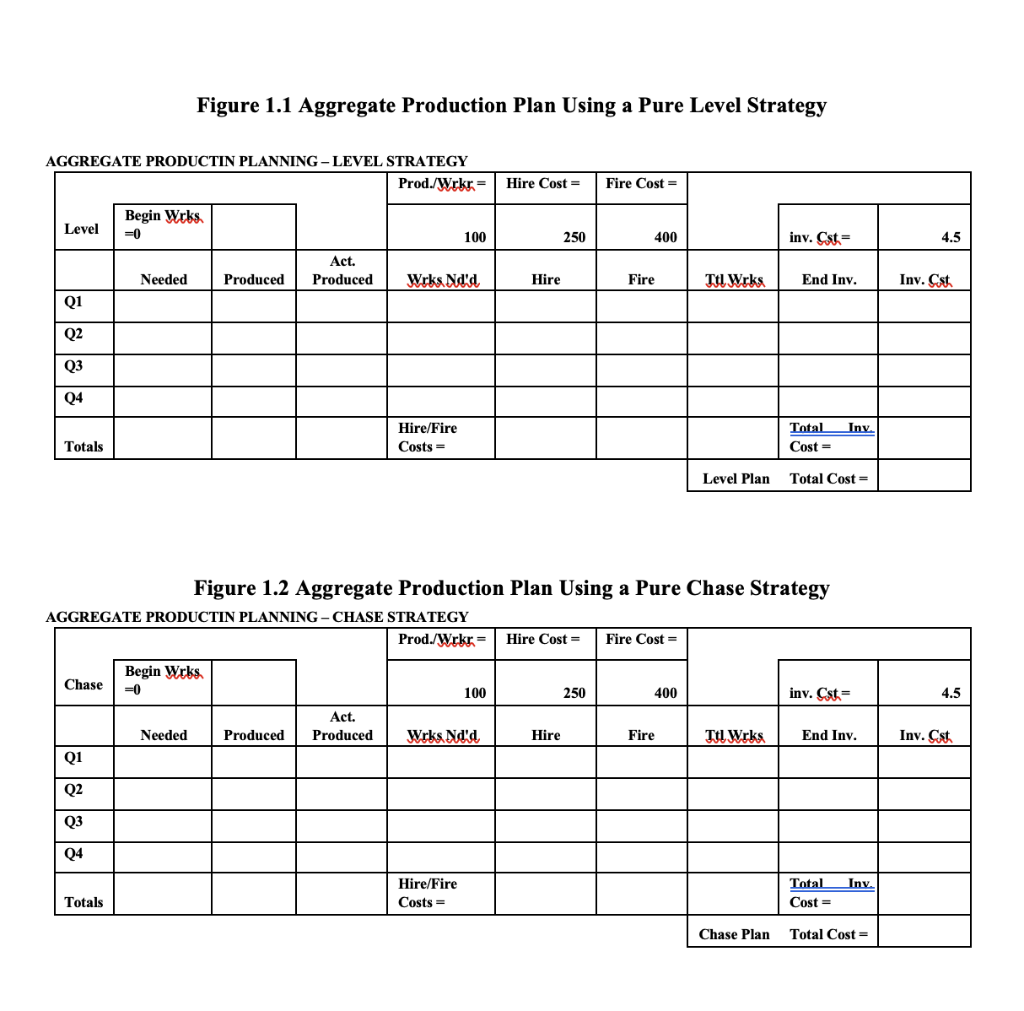
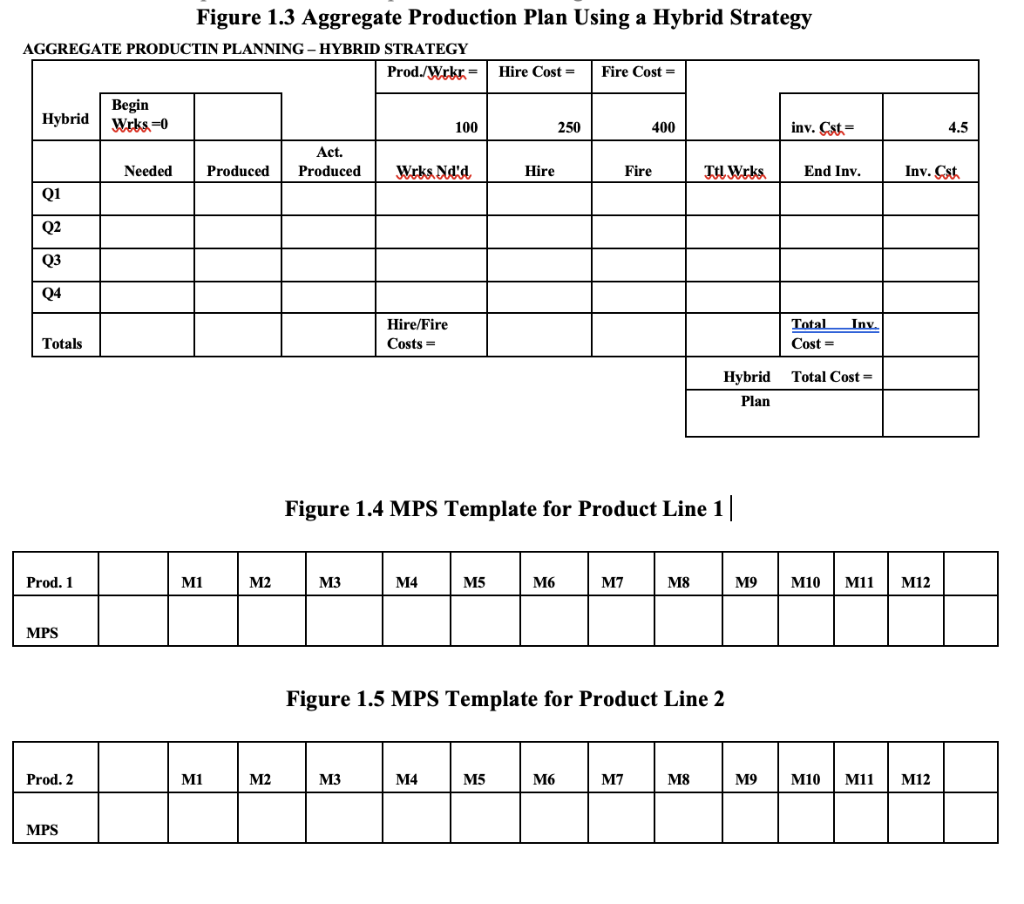
Clem's Convoluted Contingency Clem's new position included a bit of everything. She had to forecast, plan for production, master schedule, and give recommendations. This is her latest challenge and she needs your help. Finicky Forecasting Fusillade Clem was able to find the past 12 years of data on sales and believes she can create a forecast for the upcoming period of demand. Year 1 2 3 4 5 6 Demand 109,000 115,000 119,000 117,000 122,000 132,000 Year 7 8 9 10 11 12 Demand 122,000 125,000 121,000 120,000 115,000 125,000 She believes a three-year moving average or a five-year moving average may help forecast the next period's demand. The method they use now is the latest period or nave method. Help Clem develop a forecast for the next year using a latest periodave model, a three-year moving average, and a five-year moving average. She must show which model is producing the best forecast of the three models. So assist her in calculating the MAD for each model, comparing those MAD #'s, recommending the best final model, & stating the year 13 forecast to be used moving forward. Production Planning Polemic Clem has been asked to provide a rough-cut aggregate production plan. In developing an aggregate production plan, Schlaper Inc. generally takes a yearly forecast and spreads it out over four quarters. Clem knows that quarterly demand is seasonal and historically follows the ratios shown in Table 1.1. She also knows the following details about the production process (refer to Table 1.1). Table 1.1 Aggregate Production Plan Information Q1 Workers on staff now=0 Cost to hire a new worker = $250 Cost to layoff a worker = $400 Quarterly maximum capacity = 50,500 units Productivity per worker = 100 units per worker/quarter Inventory costs = $4.5 per unit per quarter Quarterly Demand Ratio = 1/6 Q2 = 3/10 Q3 = 1/5 Q4 = 1/3 = Clem knows she cannot subcontract work; she cannot have workers work overtime, or let orders go unfilled. In addition, idle workers must be laid off, new workers generally pick up how to complete the tasks quickly, training costs tend to be negligible, the amount of days worked is the same per quarter, and any workers left after the fourth quarter will be retained. Use the forecast you came up with earlier as the yearly demand and then use the ratios in Table 1.2 to spread the demand over 4 quarters to begin the Aggregate Production Planning Process. Choices, Choices, Choices: Level, Chase, Hybrid Clem's boss wants to produce units at a constant rate over each quarter, as he believes this helps keep costs low (i.e., a pure level strategy). However, Clem believes it would be more advantageous with regard to total cost to follow a pure chase strategy. She needs to identify which, if either, of the strategies are feasible and would produce the lowest total cost. She also wishes to know if there exists a hybrid strategy that outperforms (provides lower total costs) either the pure chase or pure level strategy and what that hybrid strategy would be. Complete the Level, Chase and Hybrid APP's and compare the Level, Chase, and Hybrid plans on total cost, inventory cost, and hiring/layoff costs. She needs to speak to the tradeoffs between the plans and why her final choice is considered the "best". Figures 1.1, 1.2, and 1.3 provide APP templates to assist in creating the APPs or you can use the APP XL templates provided on the course website. Martin's Master Malversation After Clem works out a suitable APP, she hands her best plan off to Martin. Martin must then create a master production schedule (MPS) for the two product lines. He has the following information, Table 1.2, on each of the product lines based on quarterly demand. In addition, he knows that the demand for the two types of units is evenly distributed over each month. Help Martin create an MPS for the two product lines. Briefly comment on how total monthly MPS numbers (e.g., the sum of Prod. 1 & Prod. 2 for M1 versus M2, etc.) change. Table 1.2 Product Line Type Information Product Type % Demand of Quarterly Demand Prod. 1 40% Prod. 2 60% Help Martin create the two master schedules with the information given. Figures 1.4 & 1.5 provide MPS templates to assist in developing the master schedules or you can use the MPS XL templates provided on the course website. Just be sure to use the Q1-Q4 APP Demand #'s you developed earlier Figure 1.1 Aggregate Production Plan Using a Pure Level Strategy AGGREGATE PRODUCTIN PLANNING-LEVEL STRATEGY Prod./Wrkru Hire Cost = Fire Cost = Level Begin Wrks. =0 100 250 400 inv. Cst 4.5 Act. Produced Needed Produced Wrks Na'a Hire Fire Tu Wrks End Inv. Inv. Cost Q1 Q2 Q3 Q4 Inv. Hire/Fire Costs Total Costa Totals Level Plan Total Cost = Figure 1.2 Aggregate Production Plan Using a Pure Chase Strategy AGGREGATE PRODUCTIN PLANNING -CHASE STRATEGY Prod./Wrkr = Hire Cost = Fire Cost = Chase Begin Wrks =0 100 250 400 inv. Cst= 4.5 Act. Produced Needed Produced Wrks Na'd Hire Fire Ttl Wrks End Inv. Inv. Cost Q1 Q2 Q3 04 Inv. Hire/Fire Costs = Total Cost = Totals Chase Plan Total Cost = Figure 1.3 Aggregate Production Plan Using a Hybrid Strategy AGGREGATE PRODUCTIN PLANNING-HYBRID STRATEGY Prod./Wrkr - Hire Costa Fire Cost = Hybrid Begin Wrks=0 100 250 400 inv. Cst 4.5 Act. Produced Needed Produced Wrks Nald Hire Fire Ttl Wrks End Inv. Inv. Cst Q1 Q2 Q3 Q4 Inv. Hire/Fire Costs = Total Cost = Totals Total Cost = Hybrid Plan Figure 1.4 MPS Template for Product Line 1] Prod. 1 M1 M2 M3 M4 M5 M6 M7 M8 M9 M10 M11 M12 MPS Figure 1.5 MPS Template for Product Line 2 Prod. 2 M1 M2 M3 M4 M5 M6 M7 M8 M9 M10 M11 M12 MPS


