

Question: itting an external tool The scatterplot below shows the temperatures of a cup of hot cocoa after it is poured into a serving cup. The
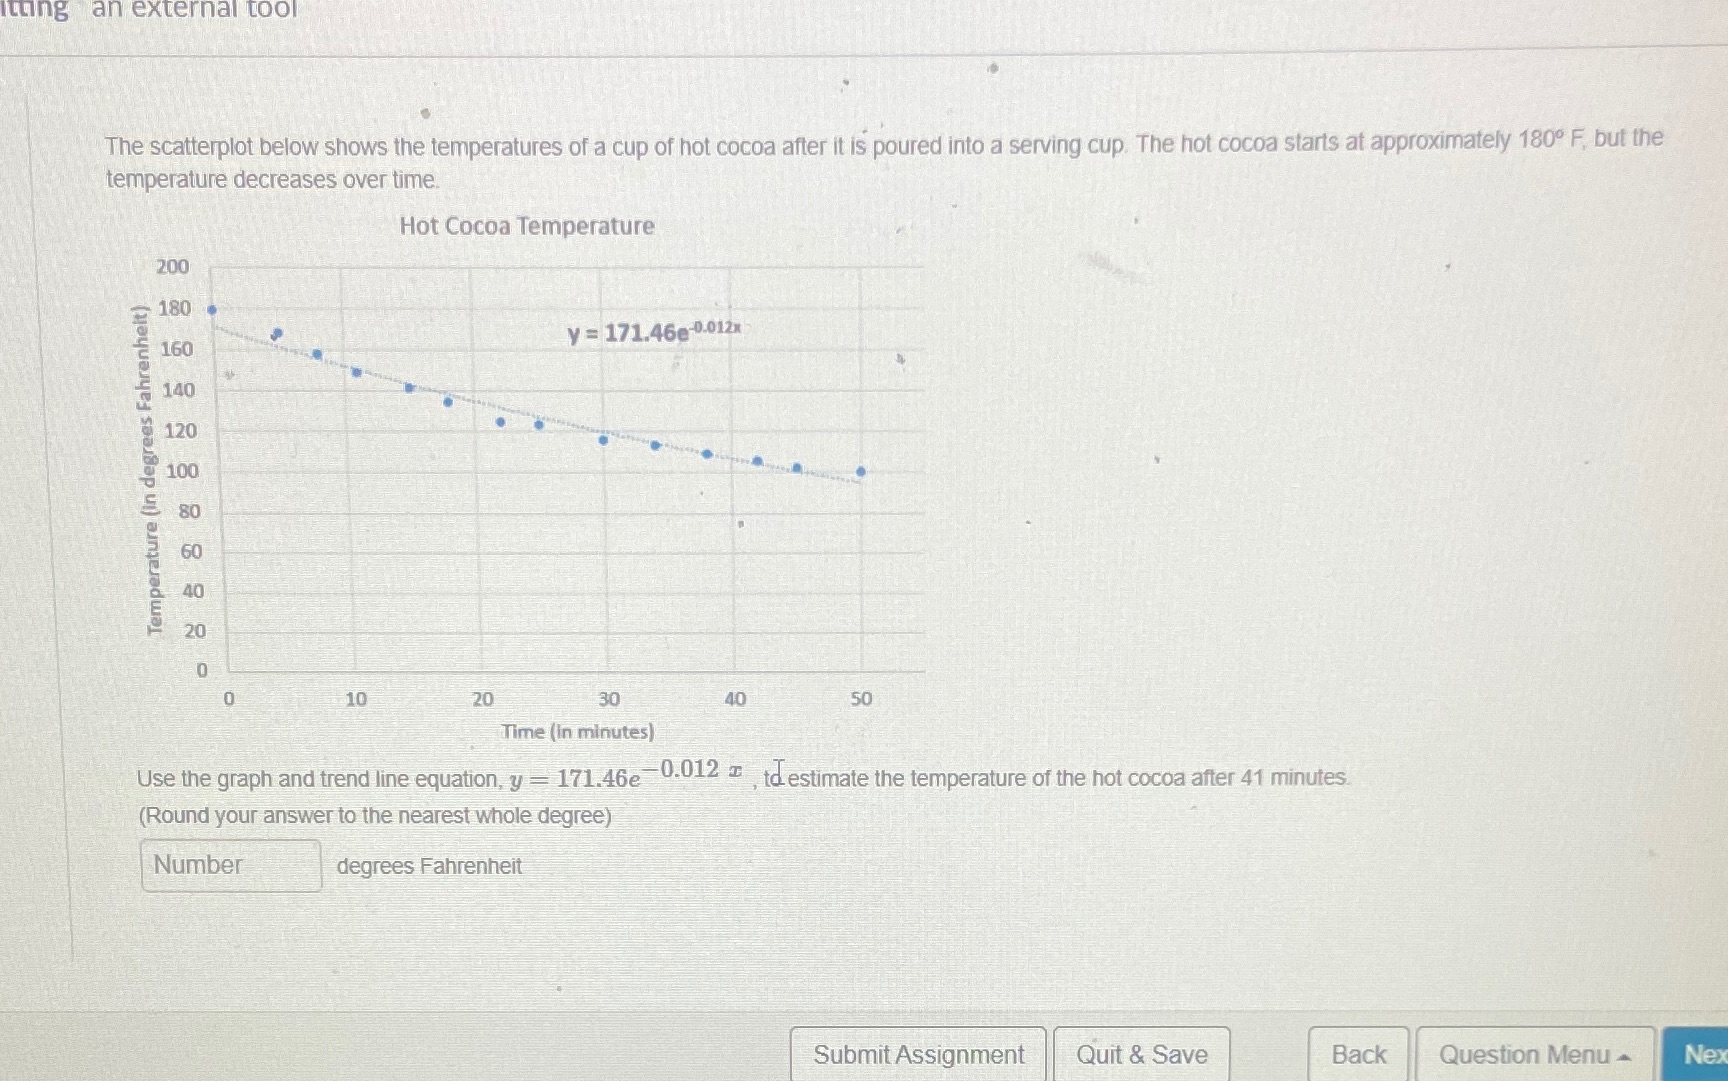
itting an external tool The scatterplot below shows the temperatures of a cup of hot cocoa after it is poured into a serving cup. The hot cocoa starts at approximately 180 F, but the temperature decreases over time. Hot Cocoa Temperature 200 180 y = 171.46e-0-012x 160 140 Temperature (in degrees Fahrenheit) 10 20 30 40 50 Time (in minutes) Use the graph and trend line equation, y - 171.46e 0:012 , to estimate the temperature of the hot cocoa after 41 minutes (Round your answer to the nearest whole degree) Number degrees Fahrenheit Submit Assignment Quit & Save Back Question Menu - Nex
Step by Step Solution
There are 3 Steps involved in it
1 Expert Approved Answer
Step: 1 Unlock

Question Has Been Solved by an Expert!
Get step-by-step solutions from verified subject matter experts
Step: 2 Unlock
Step: 3 Unlock