

Question: IV. Using utility maximization rule, and the data and graphs provided below, derive the Demand Curve for Product X. (25 Points) Qty Y Total Income

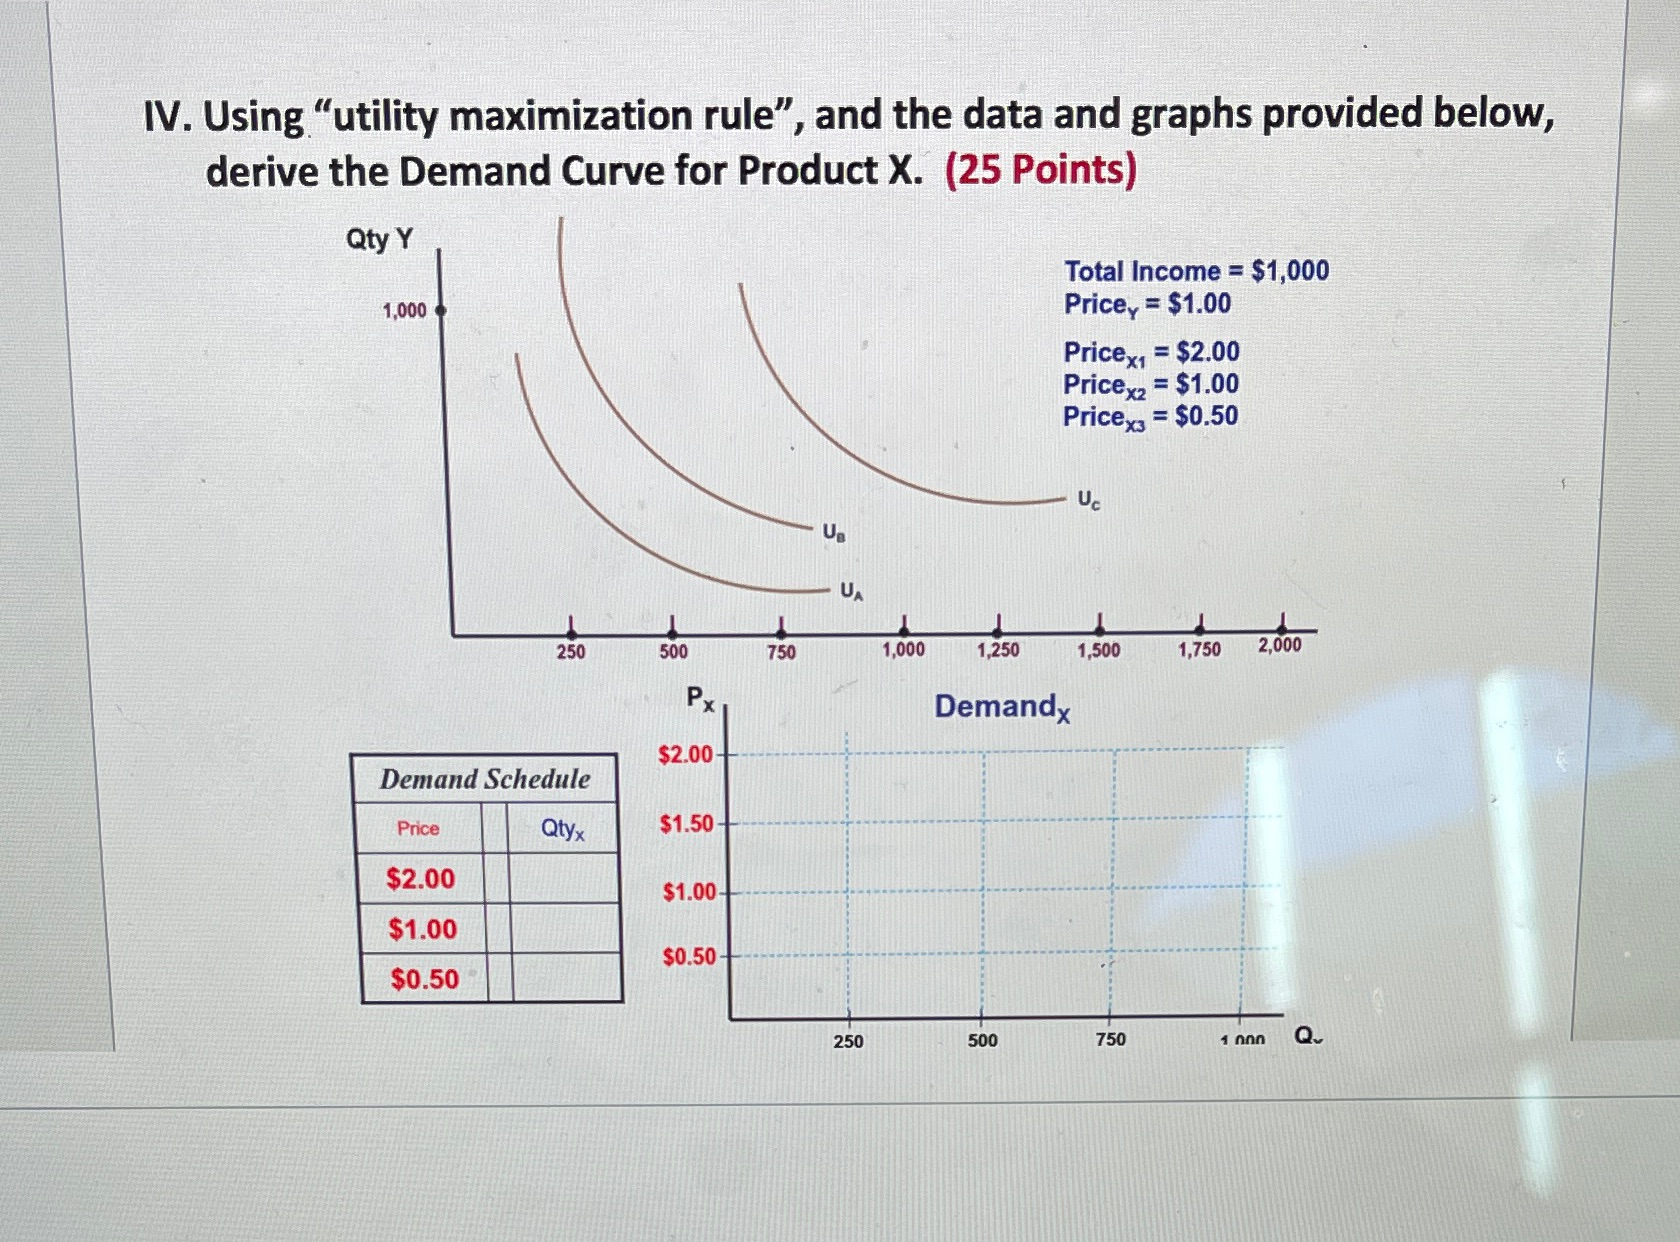
IV. Using "utility maximization rule", and the data and graphs provided below, derive the Demand Curve for Product X. (25 Points) Qty Y Total Income = $1,000 1,000 Pricey = $1.00 Pricex, = $2.00 Pricey2 = $1.00 Pricey = $0.50 Uc UA 250 500 750 1,000 1,250 1,500 1,750 2,000 Px Demandx $2.00 Demand Schedule Price Qtyx $1.50 $2.00 $1.00 $1.00 $0.50- $0.50 250 500 750 1 non
Step by Step Solution
There are 3 Steps involved in it
1 Expert Approved Answer
Step: 1 Unlock

Question Has Been Solved by an Expert!
Get step-by-step solutions from verified subject matter experts
Step: 2 Unlock
Step: 3 Unlock