

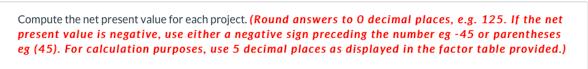
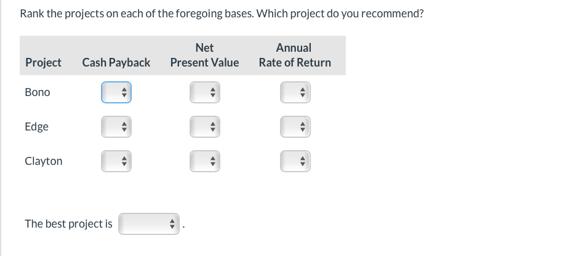
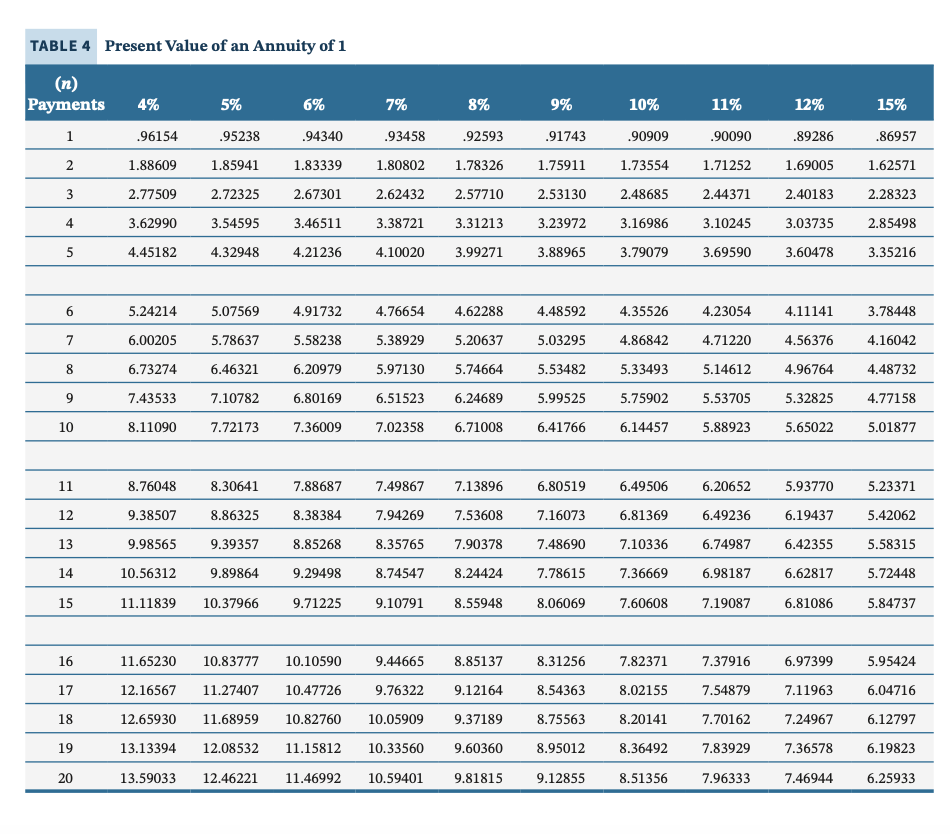
Ivanhoe Company is considering three long-term capital investment proposals. Each investment has a useful life of...
Fantastic news! We've Found the answer you've been seeking!
Question:


Transcribed Image Text:
Ivanhoe Company is considering three long-term capital investment proposals. Each investment has a useful life of 5 years. Relevant data on each project are as follows. Capital investment Annual net income: Year 1 2 3 4 5 Total Project Bono $170,000 14,980 14,980 14,980 14,980 14,980 $74,900 Project Edge Project Clayton $188,000 $206,000 19,260 18,190 17,120 12,840 9,630 $77,040 28,890 24,610 22,470 13,910 12,840 $102,720 Depreciation is computed by the straight-line method with no salvage value. The company's cost of capital is 15%. (Assume that cash flows occur evenly throughout the year.) Required Compute the net present value for each project. (Round answers to 0 decimal places, e.g. 125. If the net present value is negative, use either a negative sign preceding the number eg -45 or parentheses eg (45). For calculation purposes, use 5 decimal places as displayed in the factor table provided.) Compute the annual rate of return for each project. (Hint: Use average annual net income in your computation.) (Round answers to 2 decimal places, e.g. 10.50%.) Rank the projects on each of the foregoing bases. Which project do you recommend? Net Project Cash Payback Present Value Bono Edge Clayton The best project is Annual Rate of Return TABLE 4 Present Value of an Annuity of 1 (n) Payments 4% 1 2 3 4 5 6 7 8 9 10 11 12 13 14 15 16 17 18 19 20 .96154 1.88609 2.77509 3.62990 4.45182 5.24214 6.00205 6.73274 7.43533 8.11090 6% 5% .95238 .94340 1.85941 1.83339 2.72325 2.67301 2.62432 3.54595 3.46511 4.32948 4.21236 5.07569 5.78637 7% 9% .93458 .92593 .91743 1.80802 1.78326 1.75911 8% 11.65230 10.83777 10.10590 12.16567 11.27407 10.47726 12.65930 11.68959 10.82760 13.13394 12.08532 11.15812 13.59033 12.46221 11.46992 4.91732 4.76654 4.62288 4.48592 5.58238 5.38929 5.20637 5.03295 6.46321 6.20979 5.97130 5.74664 5.53482 7.10782 6.80169 6.51523 6.24689 7.72173 7.36009 7.02358 6.71008 2.57710 2.53130 2.48685 3.23972 3.88965 3.38721 3.31213 4.10020 3.99271 8.76048 8.30641 7.88687 7.49867 7.13896 9.38507 8.86325 8.38384 7.94269 7.53608 9.98565 9.39357 8.85268 8.35765 7.90378 10.56312 9.89864 9.29498 8.74547 8.24424 11.11839 10.37966 9.71225 9.10791 8.55948 9.44665 8.85137 9.76322 9.12164 10.05909 9.37189 10.33560 9.60360 10.59401 9.81815 10% .90909 .90090 1.73554 1.71252 2.44371 3.16986 3.10245 3.79079 3.69590 4.35526 4.86842 5.33493 5.99525 5.75902 6.41766 6.14457 6.80519 7.16073 7.48690 7.78615 8.06069 11% 8.31256 8.54363 8.75563 8.95012 12% .89286 1.69005 2.40183 3.03735 3.60478 4.23054 4.71220 4.56376 5.14612 4.96764 5.53705 5.32825 5.88923 5.65022 7.82371 7.37916 8.02155 7.54879 8.20141 7.70162 8.36492 7.83929 9.12855 8.51356 7.96333 4.11141 6.49506 6.20652 5.93770 6.81369 6.49236 6.19437 7.10336 6.74987 6.42355 7.36669 6.98187 6.62817 7.60608 7.19087 6.81086 6.97399 7.11963 7.24967 7.36578 7.46944 15% .86957 1.62571 2.28323 2.85498 3.35216 3.78448 4.16042 4.48732 4.77158 5.01877 5.23371 5.42062 5.58315 5.72448 5.84737 5.95424 6.04716 6.12797 6.19823 6.25933 TABLE 3 Present Value of 1 (n) Periods 4% 1 2 3 نیا 4 5 6 7 8 9 10 11 12 13 14 15 16 17 18 19 20 .96154 .92456 .88900 .85480 .82193 .79031 .75992 .73069 .70259 .67556 .64958 .62460 .60057 .57748 .55526 .53391 .51337 .49363 .47464 .45639 5% .95238 .90703 .86384 .82270 .78353 .74622 .71068 .67684 .64461 .61391 .58468 .55684 .53032 .50507 .48102 .45811 .43630 .41552 .39573 .37689 6% .94340 .89000 .83962 .79209 .74726 .70496 .66506 .62741 .59190 .55839 .52679 .49697 .46884 .44230 .41727 .39365 .37136 .35034 .33051 .31180 7% .93458 .87344 .81630 .76290 .71299 .66634 .62275 .58201 .54393 .50835 .47509 .44401 .41496 .38782 .36245 .33873 .31657 .29586 .27615 .25842 8% .92593 .85734 .79383 .73503 .68058 .63017 .58349 .54027 .50025 .46319 .42888 .39711 .36770 .34046 .31524 .29189 .27027 .25025 .23171 .21455 9% .91743 .84168 .77218 .70843 .64993 .59627 .54703 .50187 .46043 .42241 .38753 .35554 .32618 .29925 .27454 .25187 .23107 .21199 .19449 .17843 10% .90909 .82645 .75132 .68301 .62092 .56447 .51316 .46651 .42410 .38554 .35049 .31863 .28966 .26333 .23939 .21763 .19785 .17986 .16351 .14864 11% .90090 .81162 .73119 .65873 .59345 .53464 .48166 .43393 .39092 .35218 .31728 .28584 .25751 .23199 .20900 .18829 .16963 .15282 .13768 .12403 12% .89286 .79719 .71178 .63552 .56743 .50663 .45235 .40388 .36061 .32197 .28748 .25668 .22917 .20462 .18270 .16312 .14564 .13004 .11611 .10367 15% .86957 .75614 .65752 .57175 .49718 .43233 .37594 .32690 .28426 .24719 .21494 .18691 .16253 .14133 .12289 .10687 .09293 .08081 .07027 .06110 TABLE 2 Future Value of an Annuity of 1 (n) Payments 4% 1 2 3 4 5 6 7 8 9 10 11 12 13 14 15 16 17 18 19 20 5% 1.00000 1.00000 2.04000 2.05000 2.06000 3.12160 3.15250 3.18360 4.24646 4.31013 4.37462 5.41632 5.52563 5.63709 1.00000 6.63298 6.80191 7.89829 8.14201 9.21423 9.54911 10.58280 11.02656 12.00611 12.57789 13.48635 14.20679 15.02581 15.91713 16.62684 17.71298 18.29191 19.59863 20.02359 21.57856 21.82453 23.65749 23.69751 25.84037 25.64541 28.13238 27.67123 30.53900 29.77808 33.06595 6% 7% 1.0000 2.0700 3.2149 4.4399 5.7507 14.97164 15.7836 16.86994 17.8885 18.88214 20.1406 21.01507 22.5505 23.27597 25.1290 8% 9% 10% 12% 1.00000 1.00000 1.00000 1.00000 1.00000 2.08000 2.09000 2.10000 2.11000 2.12000 3.24640 3.27810 3.31000 3.34210 3.37440 4.50611 4.57313 4.64100 4.70973 4.77933 5.86660 5.98471 6.10510 6.22780 6.35285 6.97532 7.1533 7.33592 8.39384 8.6540 8.92280 9.89747 10.2598 10.63663 11.49132 11.9780 12.48756 13.18079 13.8164 14.48656 25.67253 27.8881 28.21288 30.8402 30.90565 33.9990 37.3790 36.78559 40.9955 33.75999 7.52334 7.71561 9.20044 9.48717 11.02847 13.02104 15.19293 11% 30.32428 33.00340 33.75023 36.97351 37.45024 41.30134 41.44626 46.01846 45.76196 51.16012 15% 1.00000 2.15000 3.47250 4.99338 6.74238 7.91286 8.11519 8.75374 9.78327 10.08901 11.06680 11.43589 11.85943 12.29969 13.72682 13.57948 14.16397 14.77566 16.78584 15.93743 16.72201 17.54874 20.30372 16.64549 17.56029 18.97713 20.14072 18.53117 19.56143 20.65458 24.34928 21.38428 22.71319 24.13313 29.00167 21.49530 22.95339 24.52271 26.21164 28.02911 34.35192 24.21492 26.01919 27.97498 30.09492 32.39260 40.50471 34.40536 37.27972 47.58041 27.15211 29.36092 31.77248 35.94973 39.18995 42.75328 55.71747 40.54470 44.50084 48.88367 65.07509 75.83636 45.59917 50.39593 55.74972 51.15909 56.93949 63.43968 88.21181 57.27500 64.20283 72.05244 102.44358 TABLE 1 Future Value of 1 (n) Periods 4% 0 1 2 3 4 5 6 7 00 8 9 10 11 12 13 14 15 16 17 18 19 20 1.26532 1.34010 1.41852 1.31593 1.40710 1.50363 1.36857 1.47746 1.59385 1.42331 1.55133 1.68948 1.48024 1.62889 1.79085 1.53945 1.60103 1.66507 1.73168 1.80094 5% 1.00000 1.00000 1.00000 1.00000 1.00000 1.04000 1.05000 1.06000 1.07000 1.08000 1.08160 1.10250 1.12360 1.14490 1.16640 1.12486 1.15763 1.19102 1.22504 1.25971 1.16986 1.21551 1.26248 1.31080 1.36049 1.21665 1.27628 1.33823 1.40255 1.46933 1.87298 1.94790 6% 2.02582 2.10685 2.19112 1.71034 1.79586 1.88565 1.97993 2.26090 2.07893 2.18287 2.29202 7% 1.50073 1.60578 1.71819 1.83846 1.96715 2.40662 2.52695 2.65330 3.20714 2.10485 2.25219 2.39656 2.75903 8% 2.54035 2.69277 2.85434 3.37993 3.02560 3.61653 3.86968 2.95216 3.15882 1.89830 2.33164 2.58043 3.15176 3.47855 2.01220 2.51817 2.81267 3.49845 3.89598 2.13293 2.40985 2.71962 3.06581 3.45227 3.88328 4.36349 2.57853 2.93719 3.34173 3.79750 4.31044 4.88711 3.17217 3.64248 4.17725 4.78459 5.47357 9% 1.00000 1.09000 1.18810 1.29503 10% 11% 12% 1.00000 1.00000 1.00000 1.10000 1.11000 1.12000 1.21000 1.23210 1.25440 1.36763 1.40493 1.33100 1.46410 1.51807 1.57352 1.68506 1.76234 1.41158 1.53862 1.61051 1.58687 1.67710 1.87041 1.97382 2.31306 1.77156 1.82804 1.94872 2.07616 2.21068 2.66002 1.71382 1.85093 1.99256 2.14359 2.30454 2.47596 3.05902 1.99900 2.17189 2.35795 2.55803 2.77308 3.51788 2.15892 2.36736 2.59374 2.83942 3.10585 4.04556 2.85312 3.13843 3.97031 4.59497 3.42594 3.70002 4.32763 5.05447 3.99602 4.71712 4.31570 5.14166 4.66096 5.60441 5.55992 6.11591 6.72750 15% 5.31089 6.13039 5.89509 6.86604 6.54355 7.68997 7.26334 8.61276 8.06231 9.64629 1.00000 1.15000 1.32250 1.52088 1.74901 2.01136 4.65239 5.35025 6.15279 7.07571 8.13706 9.35762 10.76126 12.37545 14.23177 16.36654 Ivanhoe Company is considering three long-term capital investment proposals. Each investment has a useful life of 5 years. Relevant data on each project are as follows. Capital investment Annual net income: Year 1 2 3 4 5 Total Project Bono $170,000 14,980 14,980 14,980 14,980 14,980 $74,900 Project Edge Project Clayton $188,000 $206,000 19,260 18,190 17,120 12,840 9,630 $77,040 28,890 24,610 22,470 13,910 12,840 $102,720 Depreciation is computed by the straight-line method with no salvage value. The company's cost of capital is 15%. (Assume that cash flows occur evenly throughout the year.) Required Compute the net present value for each project. (Round answers to 0 decimal places, e.g. 125. If the net present value is negative, use either a negative sign preceding the number eg -45 or parentheses eg (45). For calculation purposes, use 5 decimal places as displayed in the factor table provided.) Compute the annual rate of return for each project. (Hint: Use average annual net income in your computation.) (Round answers to 2 decimal places, e.g. 10.50%.) Rank the projects on each of the foregoing bases. Which project do you recommend? Net Project Cash Payback Present Value Bono Edge Clayton The best project is Annual Rate of Return TABLE 4 Present Value of an Annuity of 1 (n) Payments 4% 1 2 3 4 5 6 7 8 9 10 11 12 13 14 15 16 17 18 19 20 .96154 1.88609 2.77509 3.62990 4.45182 5.24214 6.00205 6.73274 7.43533 8.11090 6% 5% .95238 .94340 1.85941 1.83339 2.72325 2.67301 2.62432 3.54595 3.46511 4.32948 4.21236 5.07569 5.78637 7% 9% .93458 .92593 .91743 1.80802 1.78326 1.75911 8% 11.65230 10.83777 10.10590 12.16567 11.27407 10.47726 12.65930 11.68959 10.82760 13.13394 12.08532 11.15812 13.59033 12.46221 11.46992 4.91732 4.76654 4.62288 4.48592 5.58238 5.38929 5.20637 5.03295 6.46321 6.20979 5.97130 5.74664 5.53482 7.10782 6.80169 6.51523 6.24689 7.72173 7.36009 7.02358 6.71008 2.57710 2.53130 2.48685 3.23972 3.88965 3.38721 3.31213 4.10020 3.99271 8.76048 8.30641 7.88687 7.49867 7.13896 9.38507 8.86325 8.38384 7.94269 7.53608 9.98565 9.39357 8.85268 8.35765 7.90378 10.56312 9.89864 9.29498 8.74547 8.24424 11.11839 10.37966 9.71225 9.10791 8.55948 9.44665 8.85137 9.76322 9.12164 10.05909 9.37189 10.33560 9.60360 10.59401 9.81815 10% .90909 .90090 1.73554 1.71252 2.44371 3.16986 3.10245 3.79079 3.69590 4.35526 4.86842 5.33493 5.99525 5.75902 6.41766 6.14457 6.80519 7.16073 7.48690 7.78615 8.06069 11% 8.31256 8.54363 8.75563 8.95012 12% .89286 1.69005 2.40183 3.03735 3.60478 4.23054 4.71220 4.56376 5.14612 4.96764 5.53705 5.32825 5.88923 5.65022 7.82371 7.37916 8.02155 7.54879 8.20141 7.70162 8.36492 7.83929 9.12855 8.51356 7.96333 4.11141 6.49506 6.20652 5.93770 6.81369 6.49236 6.19437 7.10336 6.74987 6.42355 7.36669 6.98187 6.62817 7.60608 7.19087 6.81086 6.97399 7.11963 7.24967 7.36578 7.46944 15% .86957 1.62571 2.28323 2.85498 3.35216 3.78448 4.16042 4.48732 4.77158 5.01877 5.23371 5.42062 5.58315 5.72448 5.84737 5.95424 6.04716 6.12797 6.19823 6.25933 TABLE 3 Present Value of 1 (n) Periods 4% 1 2 3 نیا 4 5 6 7 8 9 10 11 12 13 14 15 16 17 18 19 20 .96154 .92456 .88900 .85480 .82193 .79031 .75992 .73069 .70259 .67556 .64958 .62460 .60057 .57748 .55526 .53391 .51337 .49363 .47464 .45639 5% .95238 .90703 .86384 .82270 .78353 .74622 .71068 .67684 .64461 .61391 .58468 .55684 .53032 .50507 .48102 .45811 .43630 .41552 .39573 .37689 6% .94340 .89000 .83962 .79209 .74726 .70496 .66506 .62741 .59190 .55839 .52679 .49697 .46884 .44230 .41727 .39365 .37136 .35034 .33051 .31180 7% .93458 .87344 .81630 .76290 .71299 .66634 .62275 .58201 .54393 .50835 .47509 .44401 .41496 .38782 .36245 .33873 .31657 .29586 .27615 .25842 8% .92593 .85734 .79383 .73503 .68058 .63017 .58349 .54027 .50025 .46319 .42888 .39711 .36770 .34046 .31524 .29189 .27027 .25025 .23171 .21455 9% .91743 .84168 .77218 .70843 .64993 .59627 .54703 .50187 .46043 .42241 .38753 .35554 .32618 .29925 .27454 .25187 .23107 .21199 .19449 .17843 10% .90909 .82645 .75132 .68301 .62092 .56447 .51316 .46651 .42410 .38554 .35049 .31863 .28966 .26333 .23939 .21763 .19785 .17986 .16351 .14864 11% .90090 .81162 .73119 .65873 .59345 .53464 .48166 .43393 .39092 .35218 .31728 .28584 .25751 .23199 .20900 .18829 .16963 .15282 .13768 .12403 12% .89286 .79719 .71178 .63552 .56743 .50663 .45235 .40388 .36061 .32197 .28748 .25668 .22917 .20462 .18270 .16312 .14564 .13004 .11611 .10367 15% .86957 .75614 .65752 .57175 .49718 .43233 .37594 .32690 .28426 .24719 .21494 .18691 .16253 .14133 .12289 .10687 .09293 .08081 .07027 .06110 TABLE 2 Future Value of an Annuity of 1 (n) Payments 4% 1 2 3 4 5 6 7 8 9 10 11 12 13 14 15 16 17 18 19 20 5% 1.00000 1.00000 2.04000 2.05000 2.06000 3.12160 3.15250 3.18360 4.24646 4.31013 4.37462 5.41632 5.52563 5.63709 1.00000 6.63298 6.80191 7.89829 8.14201 9.21423 9.54911 10.58280 11.02656 12.00611 12.57789 13.48635 14.20679 15.02581 15.91713 16.62684 17.71298 18.29191 19.59863 20.02359 21.57856 21.82453 23.65749 23.69751 25.84037 25.64541 28.13238 27.67123 30.53900 29.77808 33.06595 6% 7% 1.0000 2.0700 3.2149 4.4399 5.7507 14.97164 15.7836 16.86994 17.8885 18.88214 20.1406 21.01507 22.5505 23.27597 25.1290 8% 9% 10% 12% 1.00000 1.00000 1.00000 1.00000 1.00000 2.08000 2.09000 2.10000 2.11000 2.12000 3.24640 3.27810 3.31000 3.34210 3.37440 4.50611 4.57313 4.64100 4.70973 4.77933 5.86660 5.98471 6.10510 6.22780 6.35285 6.97532 7.1533 7.33592 8.39384 8.6540 8.92280 9.89747 10.2598 10.63663 11.49132 11.9780 12.48756 13.18079 13.8164 14.48656 25.67253 27.8881 28.21288 30.8402 30.90565 33.9990 37.3790 36.78559 40.9955 33.75999 7.52334 7.71561 9.20044 9.48717 11.02847 13.02104 15.19293 11% 30.32428 33.00340 33.75023 36.97351 37.45024 41.30134 41.44626 46.01846 45.76196 51.16012 15% 1.00000 2.15000 3.47250 4.99338 6.74238 7.91286 8.11519 8.75374 9.78327 10.08901 11.06680 11.43589 11.85943 12.29969 13.72682 13.57948 14.16397 14.77566 16.78584 15.93743 16.72201 17.54874 20.30372 16.64549 17.56029 18.97713 20.14072 18.53117 19.56143 20.65458 24.34928 21.38428 22.71319 24.13313 29.00167 21.49530 22.95339 24.52271 26.21164 28.02911 34.35192 24.21492 26.01919 27.97498 30.09492 32.39260 40.50471 34.40536 37.27972 47.58041 27.15211 29.36092 31.77248 35.94973 39.18995 42.75328 55.71747 40.54470 44.50084 48.88367 65.07509 75.83636 45.59917 50.39593 55.74972 51.15909 56.93949 63.43968 88.21181 57.27500 64.20283 72.05244 102.44358 TABLE 1 Future Value of 1 (n) Periods 4% 0 1 2 3 4 5 6 7 00 8 9 10 11 12 13 14 15 16 17 18 19 20 1.26532 1.34010 1.41852 1.31593 1.40710 1.50363 1.36857 1.47746 1.59385 1.42331 1.55133 1.68948 1.48024 1.62889 1.79085 1.53945 1.60103 1.66507 1.73168 1.80094 5% 1.00000 1.00000 1.00000 1.00000 1.00000 1.04000 1.05000 1.06000 1.07000 1.08000 1.08160 1.10250 1.12360 1.14490 1.16640 1.12486 1.15763 1.19102 1.22504 1.25971 1.16986 1.21551 1.26248 1.31080 1.36049 1.21665 1.27628 1.33823 1.40255 1.46933 1.87298 1.94790 6% 2.02582 2.10685 2.19112 1.71034 1.79586 1.88565 1.97993 2.26090 2.07893 2.18287 2.29202 7% 1.50073 1.60578 1.71819 1.83846 1.96715 2.40662 2.52695 2.65330 3.20714 2.10485 2.25219 2.39656 2.75903 8% 2.54035 2.69277 2.85434 3.37993 3.02560 3.61653 3.86968 2.95216 3.15882 1.89830 2.33164 2.58043 3.15176 3.47855 2.01220 2.51817 2.81267 3.49845 3.89598 2.13293 2.40985 2.71962 3.06581 3.45227 3.88328 4.36349 2.57853 2.93719 3.34173 3.79750 4.31044 4.88711 3.17217 3.64248 4.17725 4.78459 5.47357 9% 1.00000 1.09000 1.18810 1.29503 10% 11% 12% 1.00000 1.00000 1.00000 1.10000 1.11000 1.12000 1.21000 1.23210 1.25440 1.36763 1.40493 1.33100 1.46410 1.51807 1.57352 1.68506 1.76234 1.41158 1.53862 1.61051 1.58687 1.67710 1.87041 1.97382 2.31306 1.77156 1.82804 1.94872 2.07616 2.21068 2.66002 1.71382 1.85093 1.99256 2.14359 2.30454 2.47596 3.05902 1.99900 2.17189 2.35795 2.55803 2.77308 3.51788 2.15892 2.36736 2.59374 2.83942 3.10585 4.04556 2.85312 3.13843 3.97031 4.59497 3.42594 3.70002 4.32763 5.05447 3.99602 4.71712 4.31570 5.14166 4.66096 5.60441 5.55992 6.11591 6.72750 15% 5.31089 6.13039 5.89509 6.86604 6.54355 7.68997 7.26334 8.61276 8.06231 9.64629 1.00000 1.15000 1.32250 1.52088 1.74901 2.01136 4.65239 5.35025 6.15279 7.07571 8.13706 9.35762 10.76126 12.37545 14.23177 16.36654
Expert Answer:

Related Book For 

Accounting Principles
ISBN: 978-1118875056
12th edition
Authors: Jerry Weygandt, Paul Kimmel, Donald Kieso
Posted Date:
Students also viewed these accounting questions
-
The Borders and Noble partnership is considering three long-term capital investment proposals. Each investment has a useful life of 5 years. Relevant data on each project are as follows. Depreciation...
-
(a) For a positive integer n, show that there exists e (0, 1) such that C 1 1 1+ + 1! 2! (n+1)! Further show that (b) (*) Show that e is an irrational number. ...+ = n!e-m for some integer m.
-
3) When a drug is administered to a patient, the amount A (in milligrams) of the drug in the patient's bloodstream t minutes after injection is approximated by A(t) = 175-175e- -0.21 At what rate is...
-
Use the data in Exercise 13.28.To familiarize yourself with recursive least squares, estimate the savings functions for 19701981, 19701985, 19701990, and 19701995. Comment on the stability of...
-
A curve called Cornus spiral is defined by the parametric equations where and are the Fresnel functions that were introduced in Chapter 5 (a) Graph this curve. What happens as t→∞ and as...
-
In a game of American football, a quarterback takes the ball from the line of scrimmage, runs backward a distance of 10.0 yards, and then sideways parallel to the line of scrimmage for 15.0 yards. At...
-
After operating for a month, Shawn Andrews dental practice completed the following transactions during July: Using the steps outlined in the five-step transaction analysis, record the transactions in...
-
Bolster Foods' (BF) balance sheet shows a total of $25 million long-term debt with a coupon rate of 8.50%. The yield to maturity on this debt is 8.00%, and the debt has a total current market value...
-
How do individual differences in coping styles and resilience interact with organizational stressors to influence employee well-being, performance, and job satisfaction ?
-
When developing a marketing strategy using new digital media, a marketer must be aware of the strengths and weaknesses of these new media. Digital media are relatively new to the field of marketing...
-
If Taxable Income Is Between: 0-$9,875 $9,876-$40,125 $40,126-$85,525 $85,526-$163,300 $163.301-$207,350 $207,351-$518,400 $518.400 The Tax Due is: 10% of taxable income $987.50+12% of the amount...
-
What will be printed when the following code is executed? int sum=0; for (int x=0; x
-
1: Explain what elasticity of demand means. Support your explanation with a suitable example. 2: Describe the relationship between elasticity of demand and revenue when the prices are changed. 3:...
-
Two sound sources generate pure tones of 81 Hz and 56 Hz. What is the beat frequency?
-
A spring is intended to accelerate a projectile of ( mass 1 . 0 2 g ) to a velocity of 3 0 m / s in 0 . 1 0 s . What force is required to retain this spring? What spring constant ( k ) would be...
-
3) Determine the magnitude of the moment of the force F about a) the x-axis, b) the y-axis, and c) the z-axes. 3 ft 4 ft 2 ft C B F= {41+ 12j3k}lb
-
The program shows basic pipe usage in UNIX. In the program, parent process writes a message to pipe and child process reads the message from pipe and prints it to screen. Let's assume that a process...
-
Explain the Hawthorne effect.
-
(a) If Peoples Company had net income of $390,000 in 2017 and it experienced a 24.5% increase in net income for 2018, what is its net income for 2018? (b) If six cents of every dollar of Peoples...
-
Because Natalie has had such a successful first few months, she is considering other opportunities to develop her business. One opportunity is the sale of fine European mixers. The owner of Kzinski...
-
American Products Corporation participates in a highly competitive industry. In order to meet this competition and achieve profit goals, the company has chosen the decentralized form of organization....
-
The duties of a nozzle and a diffuser are (a) Opposite to each other (b) Identical to each other (c) Not comparable at all (d) None of these.
-
Nozzles and diffusers are widely used in (a) Heat exchangers (b) Refrigeration systems (c) Rockets and other space vehicles (d) None of these.
-
1 ton of refrigeration is equivalent to (a) \(3.517 \mathrm{~kW}\) (b) \(4.202 \mathrm{~kW}\) (c) \(250 \mathrm{kcal} / \mathrm{min}\) (d) \(50000 \mathrm{kcal} / \mathrm{min}\).

Study smarter with the SolutionInn App