

Question: I'Ve already created simulation... Pls answer the second half of the question invloving uncertainty; Please show each step USED IN EXCEL.. only answer#2 also show
I'Ve already created simulation... Pls answer the second half of the question invloving uncertainty; Please show each step USED IN EXCEL.. 

only answer#2 also show each step to determine uncertainty 
Ive also already redisisnged the chart just show me how to determine uncertainty.
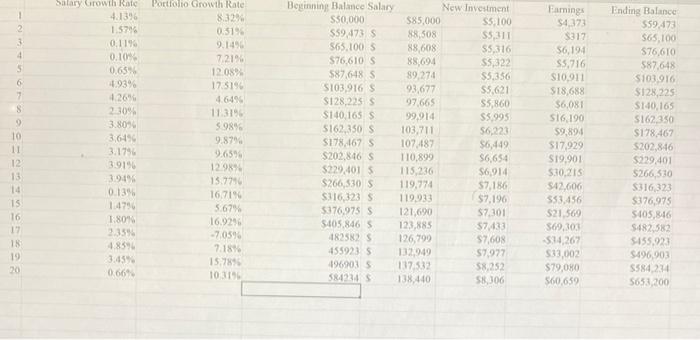
2. Redesign the spreadsheet model to incorporate the random variability of the annual salary growth rate and the annual portfolio growth rate into a simulation model. Assume that Tom is willing to use the annual investment rate that predicted a 20-year $1,000,000 portfolio in part 1. Show how to simulate Tom's 20-year financial plan. Use results from the simulation model to comment on the uncertainty associated with Tom reaching the 20-year $1,000,000 goale the annual investment rate that predicted a 20-year, $1,000,000 portfolio in part 1. Show how to simulate Tom's 20-year financial plan. Use results from the simulation model to comment on the uncertainty associated with Tom reaching the 20-year, $1,000,000 goal. 3 4 S 6 7 S 10 11 12 13 14 15 16 17 18 19 20 Salary Growth Rate 4.1396 1.579 01190 0.109 0.65 4.93% 4.26 230% 3.8096 3,6196 3.1794 3.9190 30:19 0.13% 1:47 1.80 3159 4.8394 3.45% 066 Portfolio Growth Rate 8.324 0.519 9.149 7.219 12.08 17.5190 4.6494 11.3190 5989 9.87% 9.6594 12.98% 15.7710 16.71% 5.67% 16.0296 -70590 7.187 15.789 10319 Beginning Balance Salary $50,000 $59.473 5 563.100 3 $76,610 S 587,618 S S103,916 S SI28,225 S S140,165 $ 5162,350 S 5178.167 S S202,846 S $229,401 S $266,530 S $316,323 $ $376,975 S 5.405.846 1825) 4559235 1969035 584224 New Investment 585,000 S52100 88,508 S5,311 88,608 S5,316 88,694 55322 89.274 $5.356 93,677 $5,621 97.665 55,860 99.914 $5.995 103,711 S6.223 107.487 $6,449 110,899 $6,654 115,236 $6,914 119,774 $7,186 119.933 $7.196 121,690 $7.301 123,885 57433 126,709 57,608 132.949 57.927 157.532 58.252 138,440 58,306 Farings $4373 $317 56,194 55,716 S10,911 $18.688 $6,081 SIG 190 $9,894 $17.929 S19.901 530.215 $42.606 553.456 $21.569 569,303 $14,267 $13,002 $79,080 560,639 Ending Balance $59.473 565,100 576,610 587648 S103.976 $128,225 $140,165 S162 350 $178.467 5202,846 $229,401 $266,510 5316323 $376,975 S105,846 $482582 5455,021 S496.003 5584274 5653,200 Case Problem 1. Four Corners - FourCorners.xlsx - 1 What will your portfolio be worth in 10 years? In 20 years? When can you stop working? The Human Resources Department at Four Corners Corporation was asked to develop a financial planning model that would help employees address these questions. Tom Gifford was asked to lead this effort and decided to begin by developing a financial plan for himself. Tom is 40 years old, has a degree in business, and earns an annual salary of $85,000. Through contributions to his company's retirement program and the receipt of a small inheritance, Tom has accumulated a portfolio valued at $50,000. Tom plans to work 20 more years and hopes to accumulate a portfolio valued at $1,000,000. Can he do it? Tom began with a few assumptions about his future salary, his new investment contributions, and his portfolio growth rate. He assumed a 5% annual salary growth rate and plans to make new investment contributions at 6% of his salary. After some research on historical stock market performance, Tom decided that a 10% annual portfolio growth rate was reasonable. Using these assumptions, Tom developed the Excel worksheet shown in the figure below. The worksheet provides a financial projection for the next five years. In computing the portfolio earnings for a given year, Tom assumed that his new investment contribution would occur evenly throughout the year, and thus half of the new investment could be included in the computation of the portfolio earnings for the year. From the figure below, we see that at age 45, Tom is projected to have a portfolio valued at $116,321. Tom's plan was to use this worksheet as a template to develop financial plans for the company's employees. The data in the spreadsheet would be tailored for each employee, and rows would be added to the worksheet to reflect the employee's planning horizon. After adding another 15 rows to the worksheet. Tom found that he could expect to have a portfolio of $772,722 after 20 years. Tom then took his results to show his boss, Kate Krystkowiak. Although Kate was pleased with Tom's progress, she voiced several criticisms. One of the criticisms was the assumption of a constant annual salary growth rate. She noted that most employees experience some variation in the annual salary growth rate from year to year. In addition, she pointed out that the constant annual portfolio growth rate was unrealistic and that the actual growth rate would vary considerably from year to year. She further suggested that a simulation model for the portfolio projection might allow Tom to account for the random variability in the salary growth rate and the portfolio growth rate. After some research, Tom and Kate decided to assume that the annual salary growth rate would vary from 0% to 5% and that a uniform probability distribution would provide a realistic approximation. Four a After some research, Tom and Kate decided to assume that the annual salary growth rate would vary from 0% to 5% and that a uniform probability distribution would provide a realistic approximation. Four Corners's accountants suggested that the annual portfolio growth rate could be approximated by a normal probability distribution with a mean of 10% and a standard deviation of 5%. With this information, Tom set off to redesign his spreadsheet so that it could be used by the company's employees for financial planning. Play the role of Tom Gifford and develop a simulation model for financial planning. Write a report for Tom's boss and, at a minimum, include the following: 1. Without considering the random variability, extend the current worksheet to 20 years. Confirm that by using the constant annual salary growth rate and the constant annual portfolio growth rate, Tom can expect to have a 20-year portfolio of $772,722. What would Tom's annual investment rate have to increase to in order for his portfolio to reach a 20-year $1,000,000 goal? Hint: Use Goal Seek. 2. Redesign the spreadsheet model to incorporate the random variability of the annual salary growth rate and the annual portfolio growth rate into a simulation model. Assume that Tom is willing to use the annual investment rate that predicted a 20-year, $1,000,000 portfolio in part 1. Show how to simulate Tom's 20-year financial plan. Use results from the simulation model to comment on the uncertainty associated with Tom reaching the 20-year, $1,000,000 goal.c 2. Redesign the spreadsheet model to incorporate the random variability of the annual salary growth rate and the annual portfolio growth rate into a simulation model. Assume that Tom is willing to use the annual investment rate that predicted a 20-year $1,000,000 portfolio in part 1. Show how to simulate Tom's 20-year financial plan. Use results from the simulation model to comment on the uncertainty associated with Tom reaching the 20-year $1,000,000 goale the annual investment rate that predicted a 20-year, $1,000,000 portfolio in part 1. Show how to simulate Tom's 20-year financial plan. Use results from the simulation model to comment on the uncertainty associated with Tom reaching the 20-year, $1,000,000 goal. 3 4 S 6 7 S 10 11 12 13 14 15 16 17 18 19 20 Salary Growth Rate 4.1396 1.579 01190 0.109 0.65 4.93% 4.26 230% 3.8096 3,6196 3.1794 3.9190 30:19 0.13% 1:47 1.80 3159 4.8394 3.45% 066 Portfolio Growth Rate 8.324 0.519 9.149 7.219 12.08 17.5190 4.6494 11.3190 5989 9.87% 9.6594 12.98% 15.7710 16.71% 5.67% 16.0296 -70590 7.187 15.789 10319 Beginning Balance Salary $50,000 $59.473 5 563.100 3 $76,610 S 587,618 S S103,916 S SI28,225 S S140,165 $ 5162,350 S 5178.167 S S202,846 S $229,401 S $266,530 S $316,323 $ $376,975 S 5.405.846 1825) 4559235 1969035 584224 New Investment 585,000 S52100 88,508 S5,311 88,608 S5,316 88,694 55322 89.274 $5.356 93,677 $5,621 97.665 55,860 99.914 $5.995 103,711 S6.223 107.487 $6,449 110,899 $6,654 115,236 $6,914 119,774 $7,186 119.933 $7.196 121,690 $7.301 123,885 57433 126,709 57,608 132.949 57.927 157.532 58.252 138,440 58,306 Farings $4373 $317 56,194 55,716 S10,911 $18.688 $6,081 SIG 190 $9,894 $17.929 S19.901 530.215 $42.606 553.456 $21.569 569,303 $14,267 $13,002 $79,080 560,639 Ending Balance $59.473 565,100 576,610 587648 S103.976 $128,225 $140,165 S162 350 $178.467 5202,846 $229,401 $266,510 5316323 $376,975 S105,846 $482582 5455,021 S496.003 5584274 5653,200 Case Problem 1. Four Corners - FourCorners.xlsx - 1 What will your portfolio be worth in 10 years? In 20 years? When can you stop working? The Human Resources Department at Four Corners Corporation was asked to develop a financial planning model that would help employees address these questions. Tom Gifford was asked to lead this effort and decided to begin by developing a financial plan for himself. Tom is 40 years old, has a degree in business, and earns an annual salary of $85,000. Through contributions to his company's retirement program and the receipt of a small inheritance, Tom has accumulated a portfolio valued at $50,000. Tom plans to work 20 more years and hopes to accumulate a portfolio valued at $1,000,000. Can he do it? Tom began with a few assumptions about his future salary, his new investment contributions, and his portfolio growth rate. He assumed a 5% annual salary growth rate and plans to make new investment contributions at 6% of his salary. After some research on historical stock market performance, Tom decided that a 10% annual portfolio growth rate was reasonable. Using these assumptions, Tom developed the Excel worksheet shown in the figure below. The worksheet provides a financial projection for the next five years. In computing the portfolio earnings for a given year, Tom assumed that his new investment contribution would occur evenly throughout the year, and thus half of the new investment could be included in the computation of the portfolio earnings for the year. From the figure below, we see that at age 45, Tom is projected to have a portfolio valued at $116,321. Tom's plan was to use this worksheet as a template to develop financial plans for the company's employees. The data in the spreadsheet would be tailored for each employee, and rows would be added to the worksheet to reflect the employee's planning horizon. After adding another 15 rows to the worksheet. Tom found that he could expect to have a portfolio of $772,722 after 20 years. Tom then took his results to show his boss, Kate Krystkowiak. Although Kate was pleased with Tom's progress, she voiced several criticisms. One of the criticisms was the assumption of a constant annual salary growth rate. She noted that most employees experience some variation in the annual salary growth rate from year to year. In addition, she pointed out that the constant annual portfolio growth rate was unrealistic and that the actual growth rate would vary considerably from year to year. She further suggested that a simulation model for the portfolio projection might allow Tom to account for the random variability in the salary growth rate and the portfolio growth rate. After some research, Tom and Kate decided to assume that the annual salary growth rate would vary from 0% to 5% and that a uniform probability distribution would provide a realistic approximation. Four a After some research, Tom and Kate decided to assume that the annual salary growth rate would vary from 0% to 5% and that a uniform probability distribution would provide a realistic approximation. Four Corners's accountants suggested that the annual portfolio growth rate could be approximated by a normal probability distribution with a mean of 10% and a standard deviation of 5%. With this information, Tom set off to redesign his spreadsheet so that it could be used by the company's employees for financial planning. Play the role of Tom Gifford and develop a simulation model for financial planning. Write a report for Tom's boss and, at a minimum, include the following: 1. Without considering the random variability, extend the current worksheet to 20 years. Confirm that by using the constant annual salary growth rate and the constant annual portfolio growth rate, Tom can expect to have a 20-year portfolio of $772,722. What would Tom's annual investment rate have to increase to in order for his portfolio to reach a 20-year $1,000,000 goal? Hint: Use Goal Seek. 2. Redesign the spreadsheet model to incorporate the random variability of the annual salary growth rate and the annual portfolio growth rate into a simulation model. Assume that Tom is willing to use the annual investment rate that predicted a 20-year, $1,000,000 portfolio in part 1. Show how to simulate Tom's 20-year financial plan. Use results from the simulation model to comment on the uncertainty associated with Tom reaching the 20-year, $1,000,000 goal.c Step by Step Solution
There are 3 Steps involved in it
1 Expert Approved Answer
Step: 1 Unlock

Question Has Been Solved by an Expert!
Get step-by-step solutions from verified subject matter experts
Step: 2 Unlock
Step: 3 Unlock