Question: i've attached the relevant information needed, how do I describe Morgan Stanley's usage of interest rate derivatives and how it compares to its peers? What
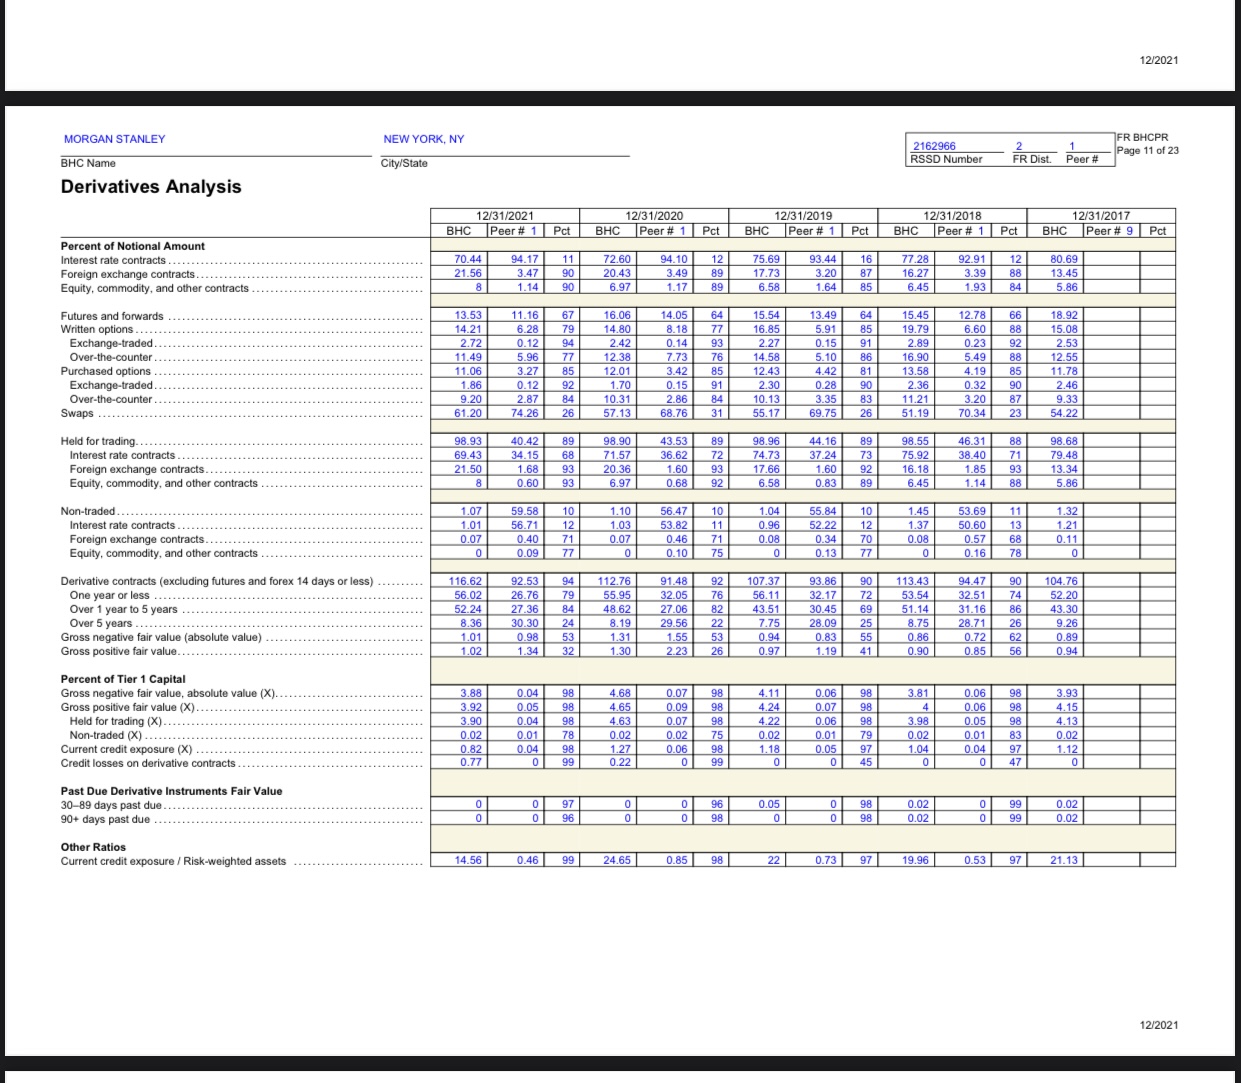
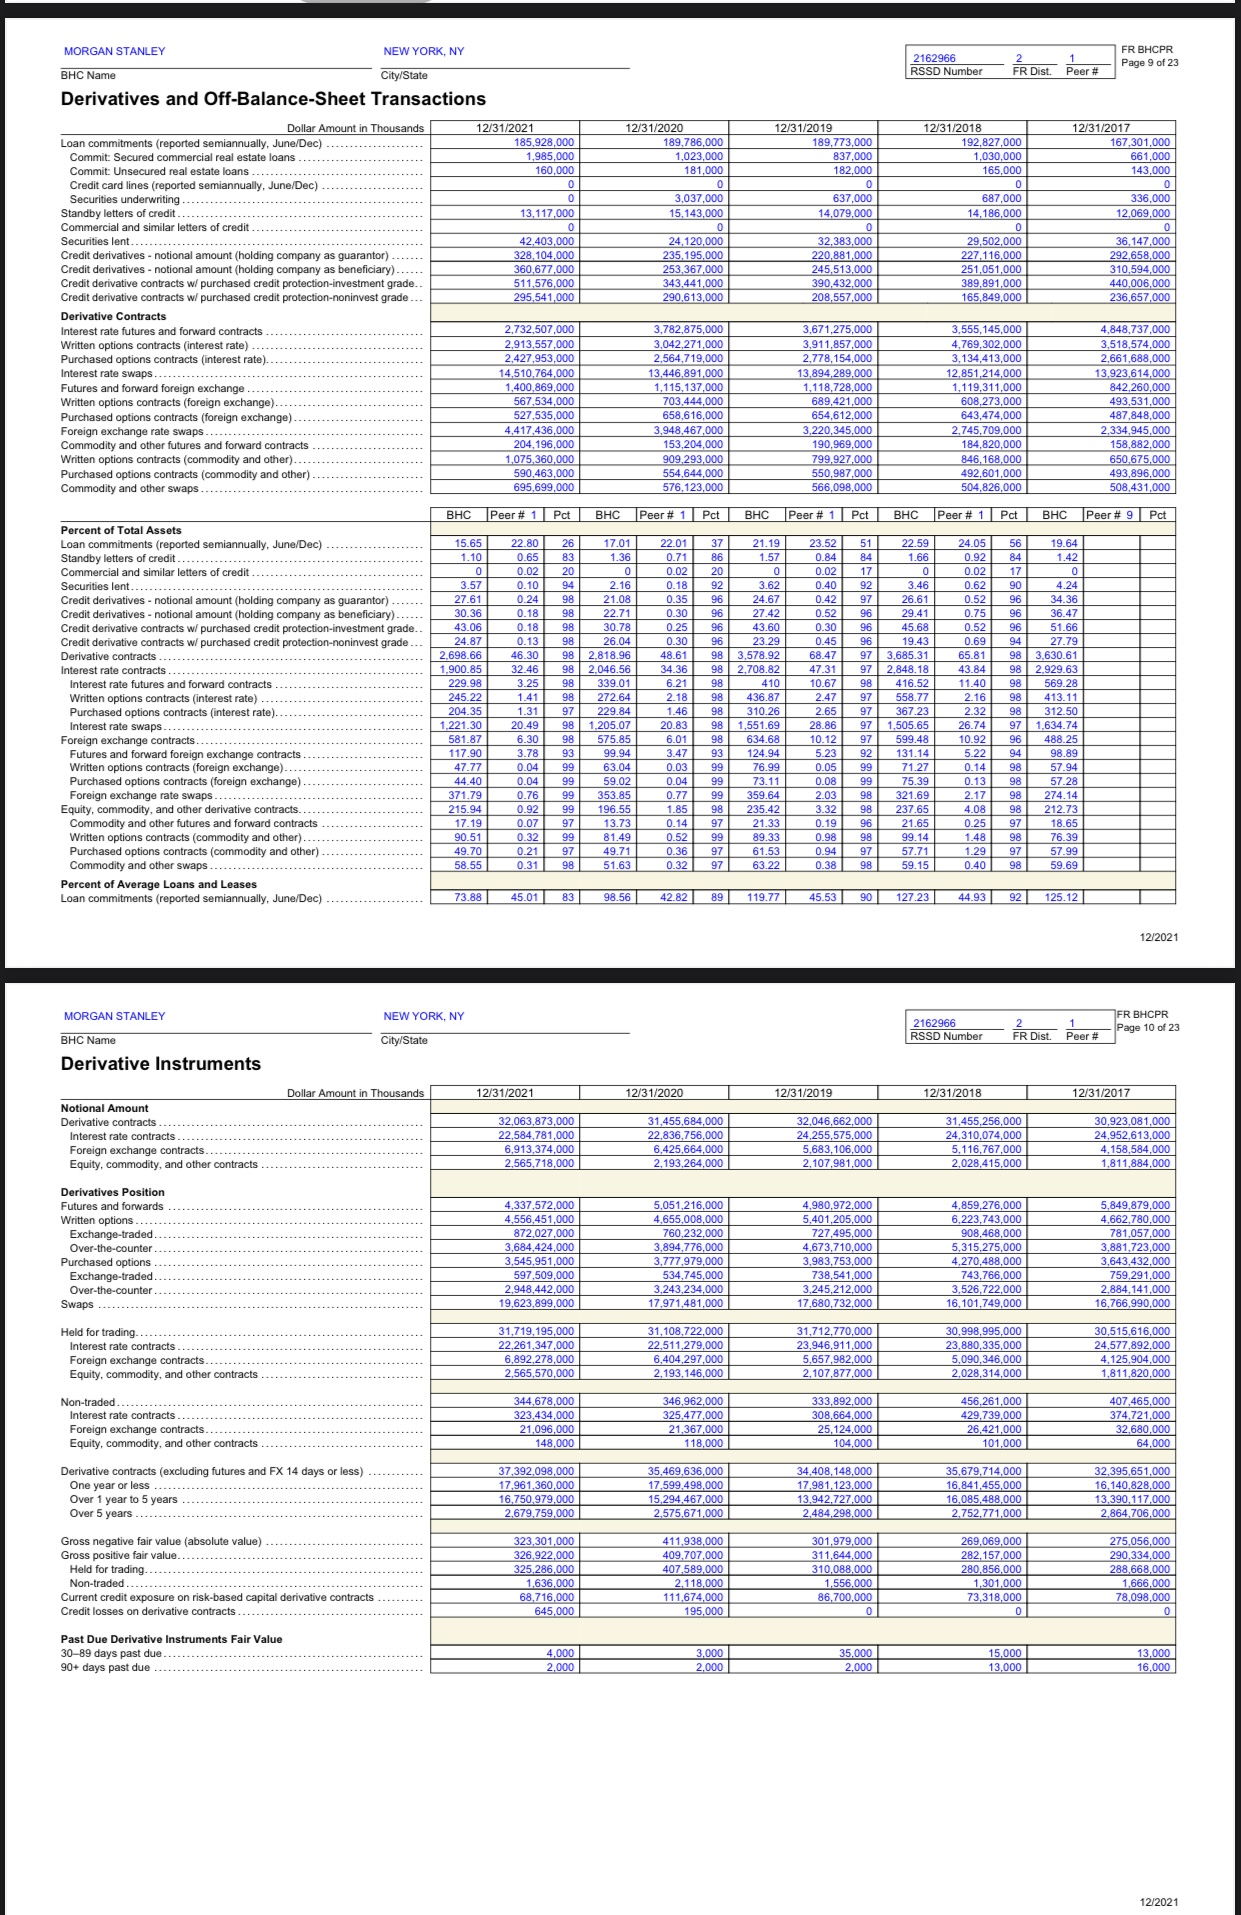
i've attached the relevant information needed, how do I describe Morgan Stanley's usage of interest rate derivatives and how it compares to its peers? What components do I focus on?
12/2021 MORGAN STANLEY NEW YORK, NY BHC Name City/State 2162966 FR BHCPR Page 11 of 23 Derivatives Analysis RSSD Number FR Dist. Peer # 12/31/2021 12/31/2020 12/31/2019 Percent of Notional Amount BHC Peer # 1 Pct 12/31/2018 BHC Peer # 1 Pct BHC Peer # 1 Pct BHC Peer # 1 Pct BHC 12/31/2017 Interest rate contracts ..... .. . . .. .. Peer # 9 Pct 70.44 Foreign exchange contracts ..... ..... 94.17 11 72.60 21.56 94.10 3.47 90 12 75.69 93.44 3.49 16 77.28 17.73 92.91 Equity, commodity, and other contracts .. 20.43 89 3.20 87 16.27 12 80.69 1.14 90 6.97 1.17 89 6.58 1.64 3.39 88 13.45 6.45 1.93 5.86 Futures and forwards .. Written options ...... 13.53 11.16 67 16.06 14.05 Exchange-traded.. 4.21 6.28 79 64 15.54 13.49 14.80 15.45 8.18 77 12.78 16.85 66 18.92 Over-the-counter ... 2.72 0.12 94 2.42 0.14 93 5.91 85 19.79 2.27 0.15 6.60 88 2.89 0.23 92 15.08 Purchased options .... 11.49 5.96 77 12.38 11.06 3.27 7.73 76 14.58 2.53 85 5.10 86 12.01 3.42 85 16.90 5.49 88 Exchange-traded .... 1.86 92 12.43 4.42 12.55 0.12 1.70 0.15 91 13.58 2.30 0.28 90 4.19 11.78 Over-the-counter .... .... 9.20 2.87 2.86 84 2.36 0.32 90 Swaps .... . . . . . ..... 84 61.20 74.26 26 10.13 3.35 57.13 68.76 31 83 2.46 11.21 55.17 3.20 87 69.75 26 51.19 70.34 23 54.22 Held for trading. .. . . . . .. .... Interest rate contracts ........... 98.93 40.42 98.90 34.15 89 43.53 69.43 98.96 Foreign exchange contracts.. 68 71.57 89 36.62 44.16 21.50 37.24 89 98.55 1.68 93 72 74.73 20.36 93 73 46.31 75.92 98.68 Equity, commodity, and other contracts . 0.60 93 17.66 6.97 1.60 92 92 38.40 71 0.68 89 16.18 1.85 93 79.48 6.58 0.83 1.14 88 13.34 6.45 5.86 Non-traded....... Interest rate contracts ........ 1.07 59.58 1.10 1.01 56.71 56.47 12 53.82 55.84 Foreign exchange contracts...... 1.03 10 1.04 0.40 71 11 0.96 52.22 10 12 1.37 53.69 1.32 0.07 Equity, commodity, and other contracts ... . 0.07 0.46 71 50.60 13 1.21 0.09 77 75 0.08 0.34 70 0.08 0.10 0.13 77 0.57 68 0.11 0.16 78 Derivative contracts (excluding futures and forex 14 days or less) .. One year or less ....... 116.62 92.53 94 112.76 107.37 Over 1 year to 5 years . ....... 56.02 91.48 26.76 79 55.95 92 32.05 93.86 76 56.11 90 113.43 32.17 94.47 72 53.54 90 104.76 52.24 84 48.62 27.06 8.36 82 43.51 32.51 74 Over 5 years . . ................. 27.36 52.20 Gross negative fair value (absolute value) .... 30.30 24 30.45 8.19 29.56 22 69 51.14 7.75 31.16 1.01 0.98 53 1.31 1.55 53 28.09 25 86 43.30 8.75 28.71 Gross positive fair value.. 1.02 32 0.94 0.83 9.26 1.34 55 26 1.30 26 0.86 2.23 0.72 62 0.89 0.97 1.19 41 0.90 0.85 5 Percent of Tier 1 Capital 0.94 Gross negative fair value, absolute value (X).. Gross positive fair value (X) . . 3.88 0.04 98 3.92 4.68 0.05 0.07 98 4.65 98 4.11 0.06 Held for trading (X) .. 0.09 98 3.81 4.24 0.07 0.06 98 3.93 3.90 Non-traded (X) . .. ...... 0.04 4.63 0.07 0.02 0.01 78 98 98 4 4.22 0.06 98 0.06 0.02 98 3.98 0.05 98 4.15 4.13 Current credit exposure (X) ... . . ...... 0.82 0.04 0.02 75 98 0.02 1.27 0.06 0.01 79 1.18 0.02 0.01 0.02 Credit losses on derivative contracts .. 83 0.77 99 0.05 0.22 1.04 45 0.04 97 47 1.12 Past Due Derivative Instruments Fair Value 30-89 days past due ........... 90+ days past due .. . . ... of 0 97 0 96 0.05 0 0.02 0.02 0 99 0.02 0.02 Other Ratios Current credit exposure / Risk-weighted assets 14.56 0.46 99 24.65 0.85 98 22 0.73 97 19.96 0.53 97 21.13 12/2021MORGAN STANLEY NEW YORK, NY BHC Name 162966 FR BHCPR City/State RSSD Number FR Dist. Peer # Page 9 of 23 Derivatives and Off-Balance-Sheet Transactions Dollar Amount in Thousands 12/31/2021 12/31/2020 12/31/2019 Loan commitments (reported semiannually, June/Dec) .................... 12/31/2018 12/31/2017 185,928,00 189,786,000 189,773,000 192,827,000 Commit: Secured commercial real estate loans .. 1.985,000 167,301,000 1,023,000 837,000 1,030,000 Commit: Unsecured real estate loans . 661,000 160,000 181,000 182,000 Credit card lines (reported semiannually, June/Dec) . 165,000 143,000 Securities underwriting . 3,037,000 637,000 Standby letters of credit ... 13,117,000 687,000 336,000 15,143.000 Commercial and similar letters of credit .. 14,079,000 4,186,000 12,069,000 Securities lent.. 42,403,00 Credit derivatives - notional amount (holding co 28,104,00 24,120,000 32,383,000 y as guarantor) . 29,502,000 36,147,000 35,195,000 20.881,000 Credit derivatives - notional amount (holding com 27.116,000 292,658,000 360.677,000 253,367,000 Credit derivative contracts w/ purchased credit protection-investment grade. 245,513,000 511,576,000 251,051,000 310,594,000 Credit derivative contracts w/ purchased credit protection-noninvest grade .. 295,541,000 343,441,000 390,432,000 389,891,000 440,006,000 290.613,000 208,557,000 165,849,000 236,657,000 Derivative Contracts Interest rate futures and forward contracts 2.732.507,000 3,782,875,000 3,671,275,000 3.555,145,000 written options contracts (interest rate) ...... 2.913.557,000 3.042,271,000 1.848,737,000 3.911,857,000 Purchased options contracts (interest rate).. 4.769,302,000 3.518,574,000 2,427.953,000 Interest rate swaps ... 2.564.719,000 4.510,764,000 2,778,154,000 3.134,413,000 2,661.688,000 Futures and forward foreign exchange .. 1.400.869,000 3,446,891,000 13,894,289,000 2,851,214,000 1.115.137,000 ten options contracts (foreign exchange). 1.118,728,000 3,923,614,000 1.119,311,000 527.535,000 703.444,000 842.260,000 689.421,000 608,273,000 Purchased options contracts (foreign exchange 658,616,000 493.531,000 654.612,000 Foreign exchange rate swap 417.436,000 643,474,000 487,848,000 3,948,467,000 220,345,000 Commodity and other futures and forward contracts . 204.196,000 745,709,000 334,945,000 153,204,000 ten options contracts (commodity and other).. 190.969,000 184,820,000 158,882,000 1,075,360,000 909,293,000 99.927,000 846,168,000 650.675,000 ased options contracts (commodity and other) 590.463,000 554.644,000 650,987,000 Commodity and other swaps ... 695.699,000 492.601,000 493,896,000 $76.123,000 566,098,000 504,826,000 508.431,000 BHC Peer # 1 Pct BHC Peer # 1 Pct BHC Peer # 1 Pct BHC Peer # 1 Pct BHC Peer # 9 Pct Percent of Total Assets Loan commitments (reported semiannually, June/Dec) ....... 15.65 Standby letters of credit ... 1 10 22.80 22.01 37 21.19 23.52 24.05 83 1.36 0.71 86 1.57 0.84 84 1 66 9.64 Commercial and similar letters of credit 0.92 84 0 1.42 0.02 Securities lent..... .. . . . . .........; 0.18 20 0.02 0.02 3.62 90 Credit derivatives - notional amount (holding con 2.16 3.46 27.61 Credit derivatives - notional amount (holding com 0.35 96 97 30.36 0.18 21.08 24.67 0.52 0.18 30.78 0.30 26.61 96 34.36 Credit derivative contracts w/ purchased credit protection-investment grade. 0.25 43.60 0.30 29.41 0.52 96 Credit derivative contracts w/ purchased credit protection-noninvest grade . 24.87 0.13 Derivative contracts .. 26.04 0.30 96 23.29 0.45 96 19.43 0.69 94 900.85 -32 26 2.818.96 2, 708 .82 68.47 27.79 Interest rate contracts ............... 3.685.31 Interest rate futures and forward contracts 8 8 8 410 48. 18 65.81 Written options contracts (interest rate) .... 229.98 3.25 339.01 204.35 272.64 36.87 hased options contracts (interest rate). Interest rate swaps. . 1.31 1.221.30 229.84 310.26 19 9 9 Foreign exchange contracts.. 581.87 20.49 1.205.07 1.551.69 97 Futures and forward foreign exchange contracts 3.78 99.84 124.94 10.92 5.22 Written options contracts (foreign exchange) .... Purchased options contracts (foreign exchange) . . 47.77 0.04 76.98 0.14 Foreign exchange rate swaps .................. 371.79 Equity, commodity, and other deriv 215.94 Commodity and other futures and forward contracts 17.19 94898 8 8 9898 8 Written options contracts (commodity and other) ... 90.51 Purchased options contracts (comm 49.70 Commodity and other swaps ....... 53.22 Percent of Average Loans and Leases Loan commitments (reported semiannually, June/Dec) ............... 73.88 45.01 83 98.56 42.82 119.77 45.53 127.23 44.93 92 125.12 12/2021 MORGAN STANLEY NEW YORK , NY FR BHCPR BHC Name 2162966 City/State RSSD Number FR Dist. Peer # Page 10 of 23 Derivative Instruments Dollar Amount in Thousands 12/31/2021 12/31/2020 12/31/2019 12/31/2018 Notional Amount 12/31/2017 e contracts Interest rate contracts ..... 22.584,781,000 31.455.684,000 32.046,662,000 22,836,756,000 24.255,575,000 31.455,256,000 0.923,081,000 Foreign exchange contracts... 24,310,074,000 6.913,374,000 24.952,613,000 6.425.664,000 Equity, commodity, and other contracts 5.683,106,000 5,116,767,000 2,565,718,000 4.158,584,000 2,193,264,000 2.107.981,000 2.028.415,000 1.811,884,000 Derivatives Position Futures and forwards Written options ....... 5,051,216,00 .655.008,000 .980,972,000 .401,205,000 .859.276,000 ,849,879,000 Exchange-traded ... 872.027.000 5.223,743,000 662,780,000 Over-the-counter .. 760.232,000 3.684.424,000 727.495,000 908,468,000 781.057,000 urchased options . .894.776,000 1.673,710,000 3.545.951,000 .315.275,000 .777.979,000 .983,753,000 .881.723,000 Exchange-traded .. ,270,488,000 3,643,432,000 597.509,000 534,745,000 738,541,000 Over-the-counter .. 2.948.442,000 743,766,000 759.291,000 swaps ......... ... ...... 19.623,899,000 3,243.234,000 3,245,212,000 7.971.481,000 3.526,722,000 7.680,732,000 2.884.141,000 16, 101,749,000 6,766,990,000 Held for trading. ......... 31,719,195,000 31,108.722,000 Interest rate contracts ........ 31,712,770,000 2,261,347,000 22,511,279,000 30.998,995,000 30.515.616,000 23,946,911,000 Foreign exchange contracts. 23.880,335,000 4.577.892,000 6.892.278,000 6,404,297,000 Equity, commodity, and other contracts . .565.570,000 5.657,982,000 5,090,346,000 4.125,904,000 2. 193,146,000 2.107.877,000 -028,314,000 .811,820,000 Non-traded. Interest rate contracts . 344.678,000 346,962,000 333,892,000 323,434.000 325.477.000 #36,261,000 308.664,000 Foreign exchange contracts.. 429,739,000 21,096,000 374.721,000 21,367.000 Equity, commodity, and other contracts .. 25,124,000 26,421,000 32,680,000 148,000 118,000 104,000 101.000 64,000 Derivative contracts (excluding futures and FX 14 days or les $7,392,098,000 One year or less ... 35,469,636,000 34,408,148,000 35,679,714,000 7.961.360.000 32,395,651,000 Over 1 year to 5 years .. 17.599.498,000 6,750.979.000 17.981.123,000 16,841,455,000 15,294.467.000 13,942.727.000 16.140,828,000 Over 5 years .............. 2,679,759,000 16.085,488,000 13,390,117,000 2.575.671,000 2,484,298,000 2,752,771.000 2,864.706,000 Gross negative fair value (absolute value) 323,301,000 411,938,000 Gross positive fair value........... 301,979,000 269,069,000 26,922,000 109,707,000 275,056,000 Held for trading. . 311.644,000 325,286,000 282,157.000 07.589,000 290,334,000 Non-traded ... 310,088,000 80.856,000 1,636.00 Current credit exposure on risk-based c 2,118.000 1.556,000 1,301.000 1,666,000 68,716,000 Credit losses on derivative contracts ... 111,674,000 86,700,000 645,000 73,318,000 78,098,000 195,000 Past Due Derivative Instruments Fair Value 30-89 days past due .... 4,000 90+ days past due .. 3,000 35.000 15.000 13,000 2,000 2,000 2,000 13,000 16,000 12/2021
Step by Step Solution
There are 3 Steps involved in it
1 Expert Approved Answer
Step: 1 Unlock
Question Has Been Solved by an Expert!
Get step-by-step solutions from verified subject matter experts
Step: 2 Unlock
Step: 3 Unlock
Students Have Also Explored These Related Finance Questions!