

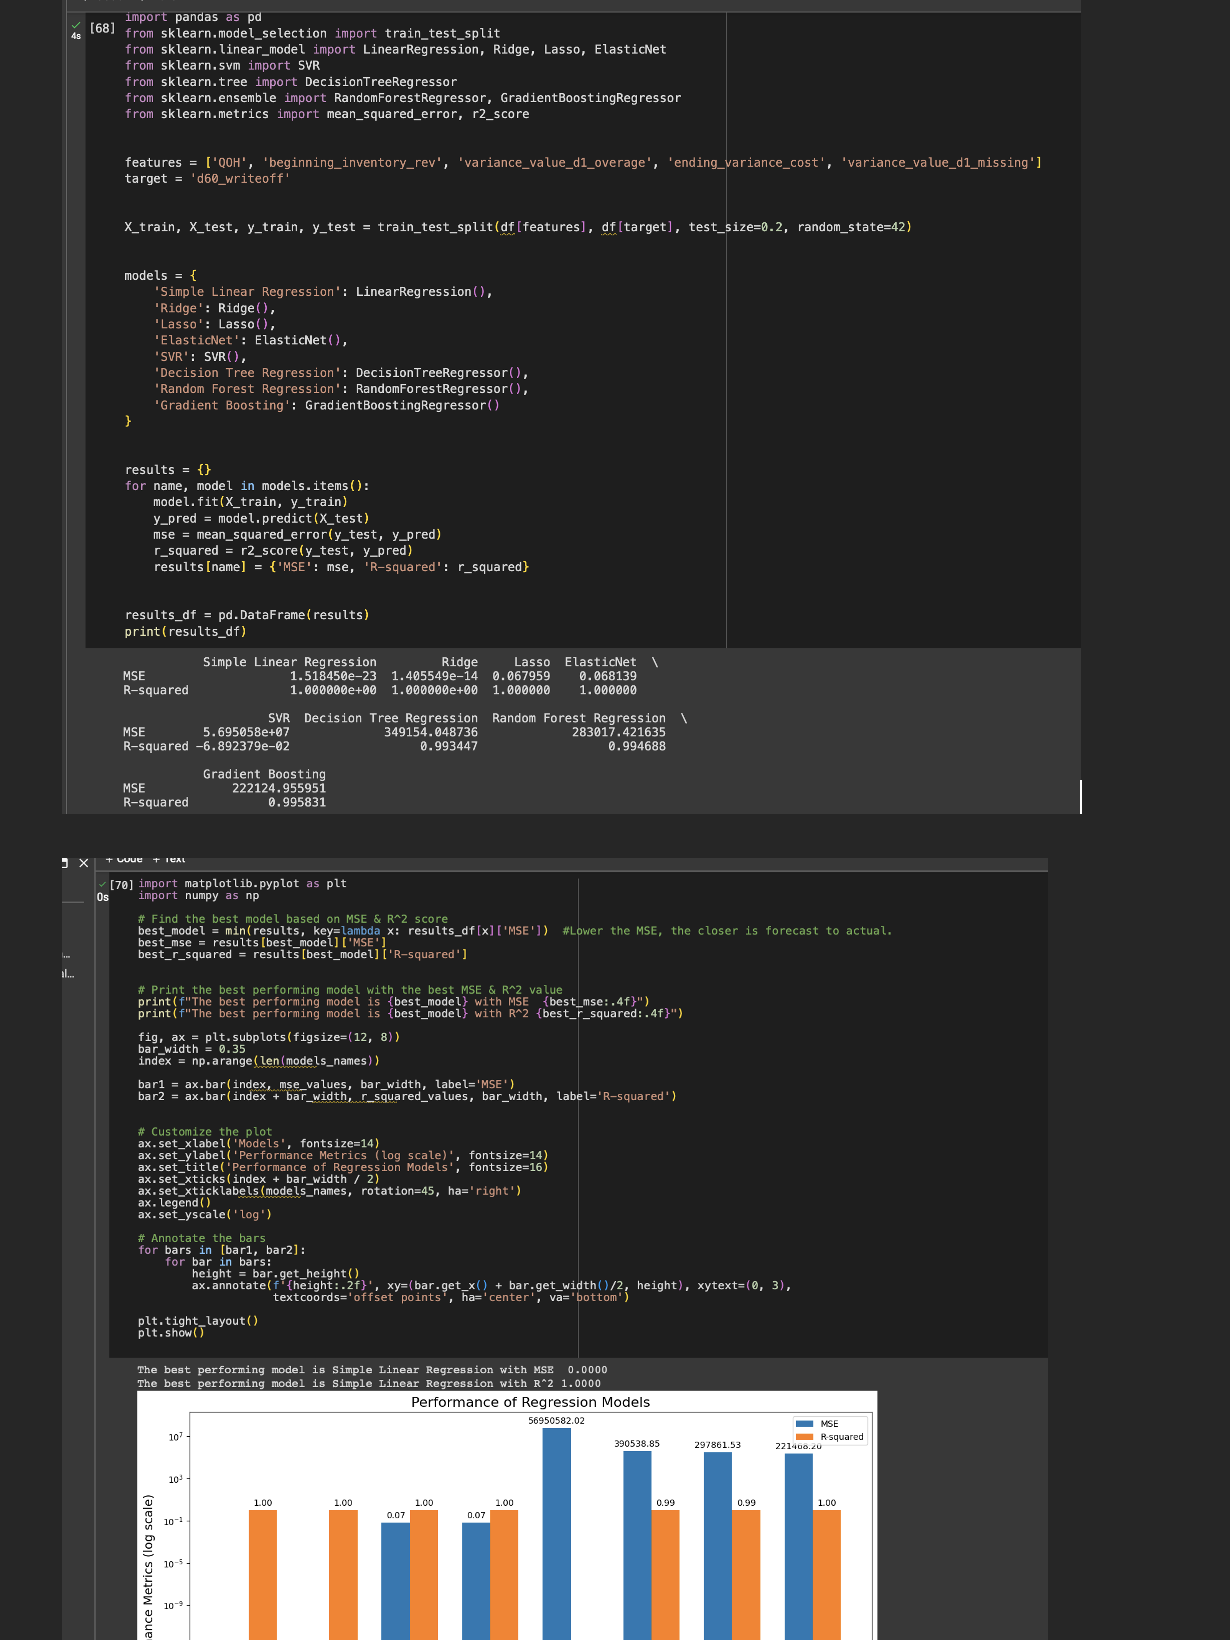
Question: I've created a regression model and it prints the score of MSE and R ^ 2 for each model. However, if you notice the MSE
I've created a regression model and it prints the score of MSE and R for each model. However, if you notice the MSE value of linear regression is approximately. Why in the graph shows MSE is There's no model with MSE That's almost impossible. Also, I choose min to print the value with the best MSE because the lower MSE, the closer to the actual values but i tried max and it didnt solve the issue either. I want the graph to reflect the which it looks more real.
Step by Step Solution
There are 3 Steps involved in it
1 Expert Approved Answer
Step: 1 Unlock

Question Has Been Solved by an Expert!
Get step-by-step solutions from verified subject matter experts
Step: 2 Unlock
Step: 3 Unlock