

Question: Ive learned one way to do this but have seen others do it differently and am confused. Would someone mind writing out this 3 sigma
Ive learned one way to do this but have seen others do it differently and am confused. Would someone mind writing out this 3 sigma x bar and r chart calculations for me? Just need the control limits. Not sure when to use the given subgroups chart or another formula. Thanks in advance!
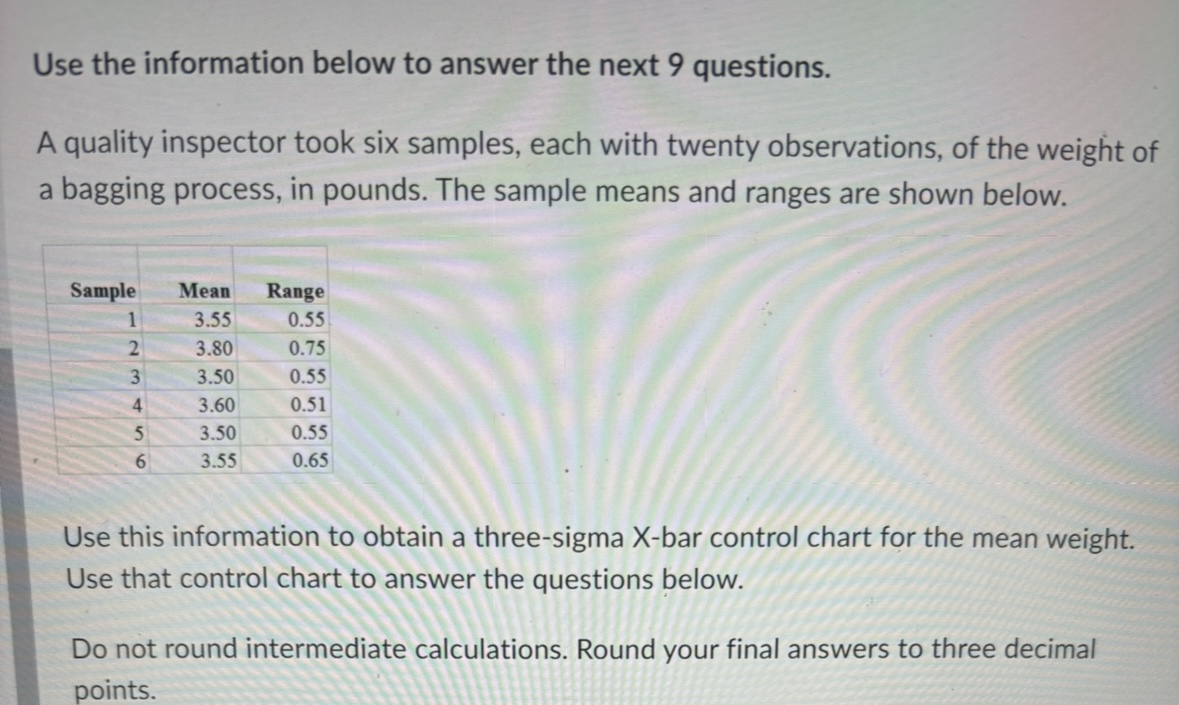
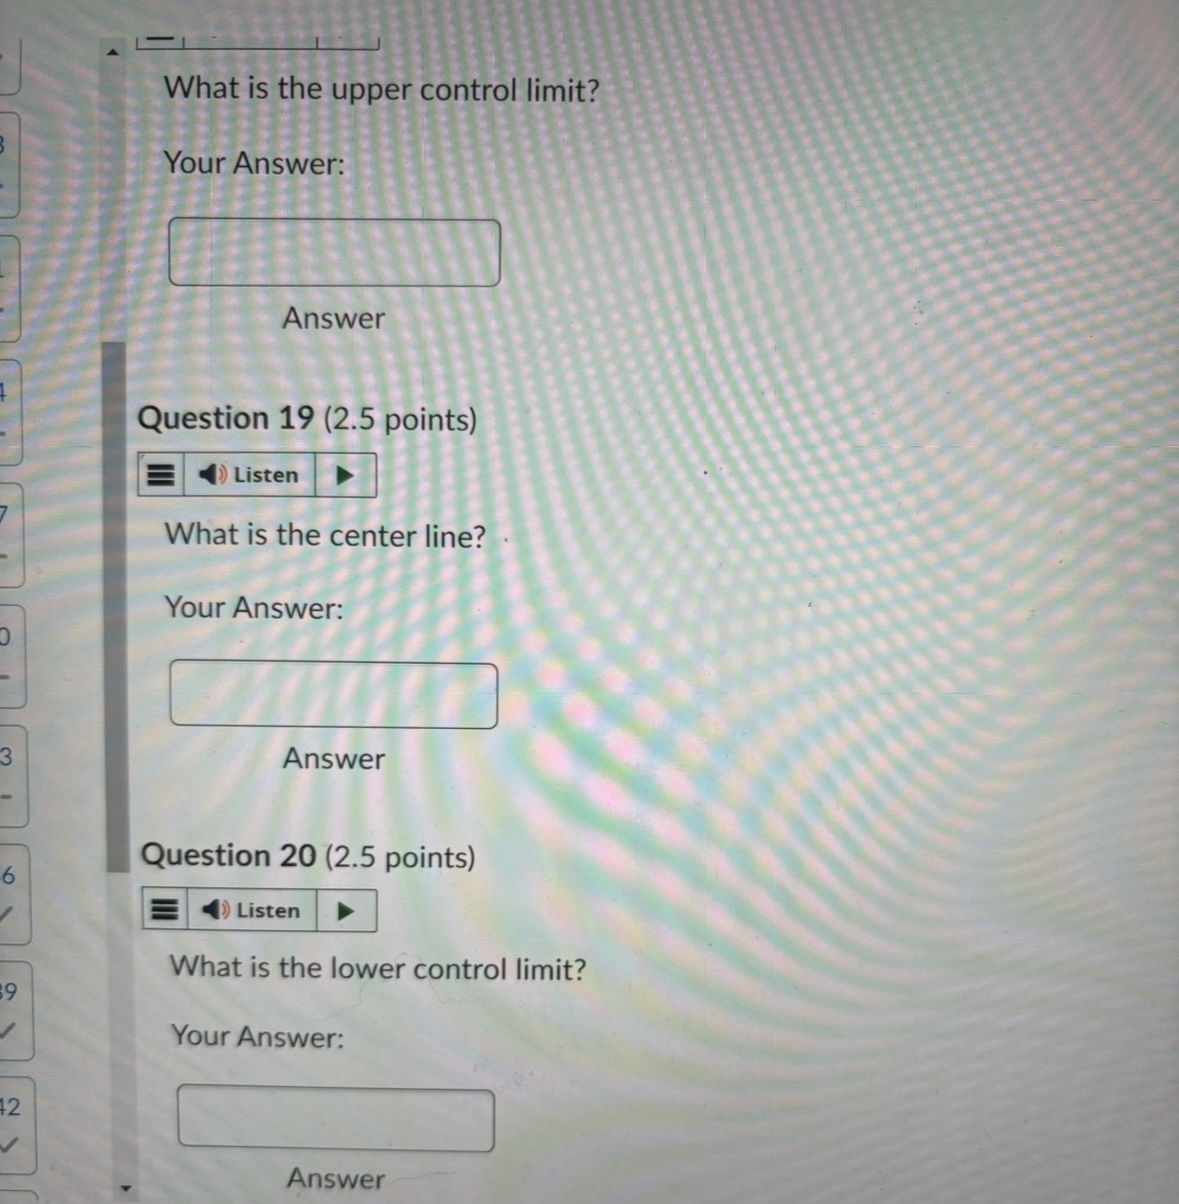
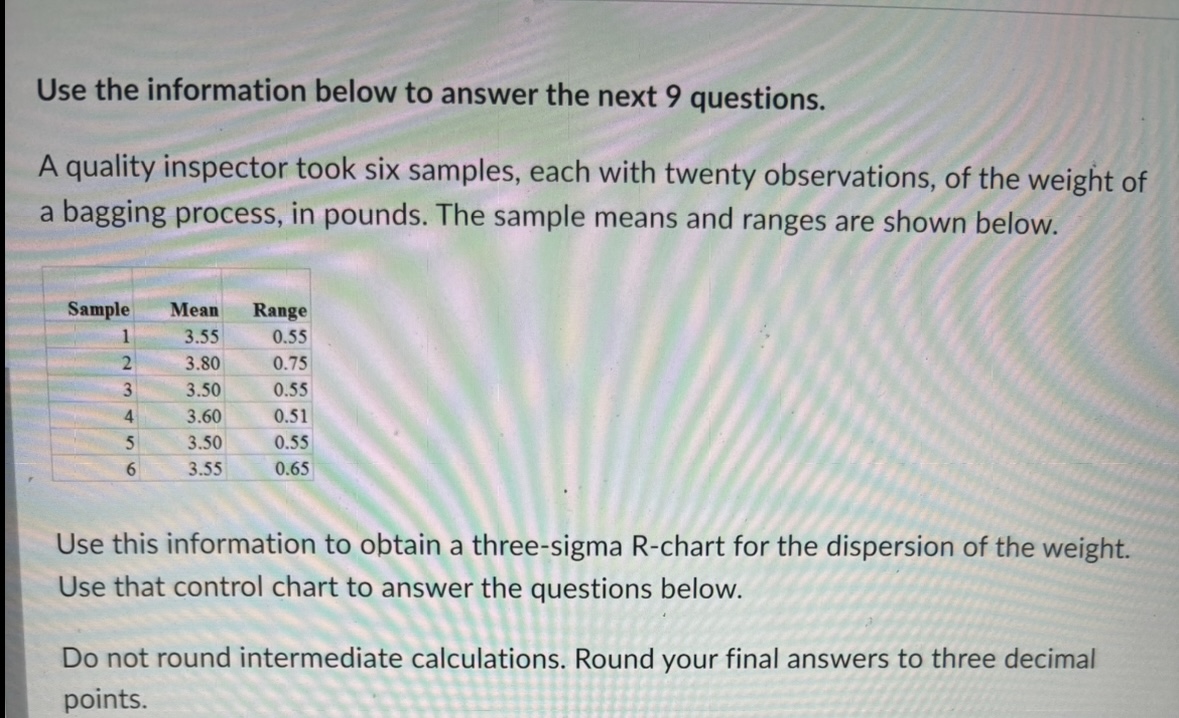
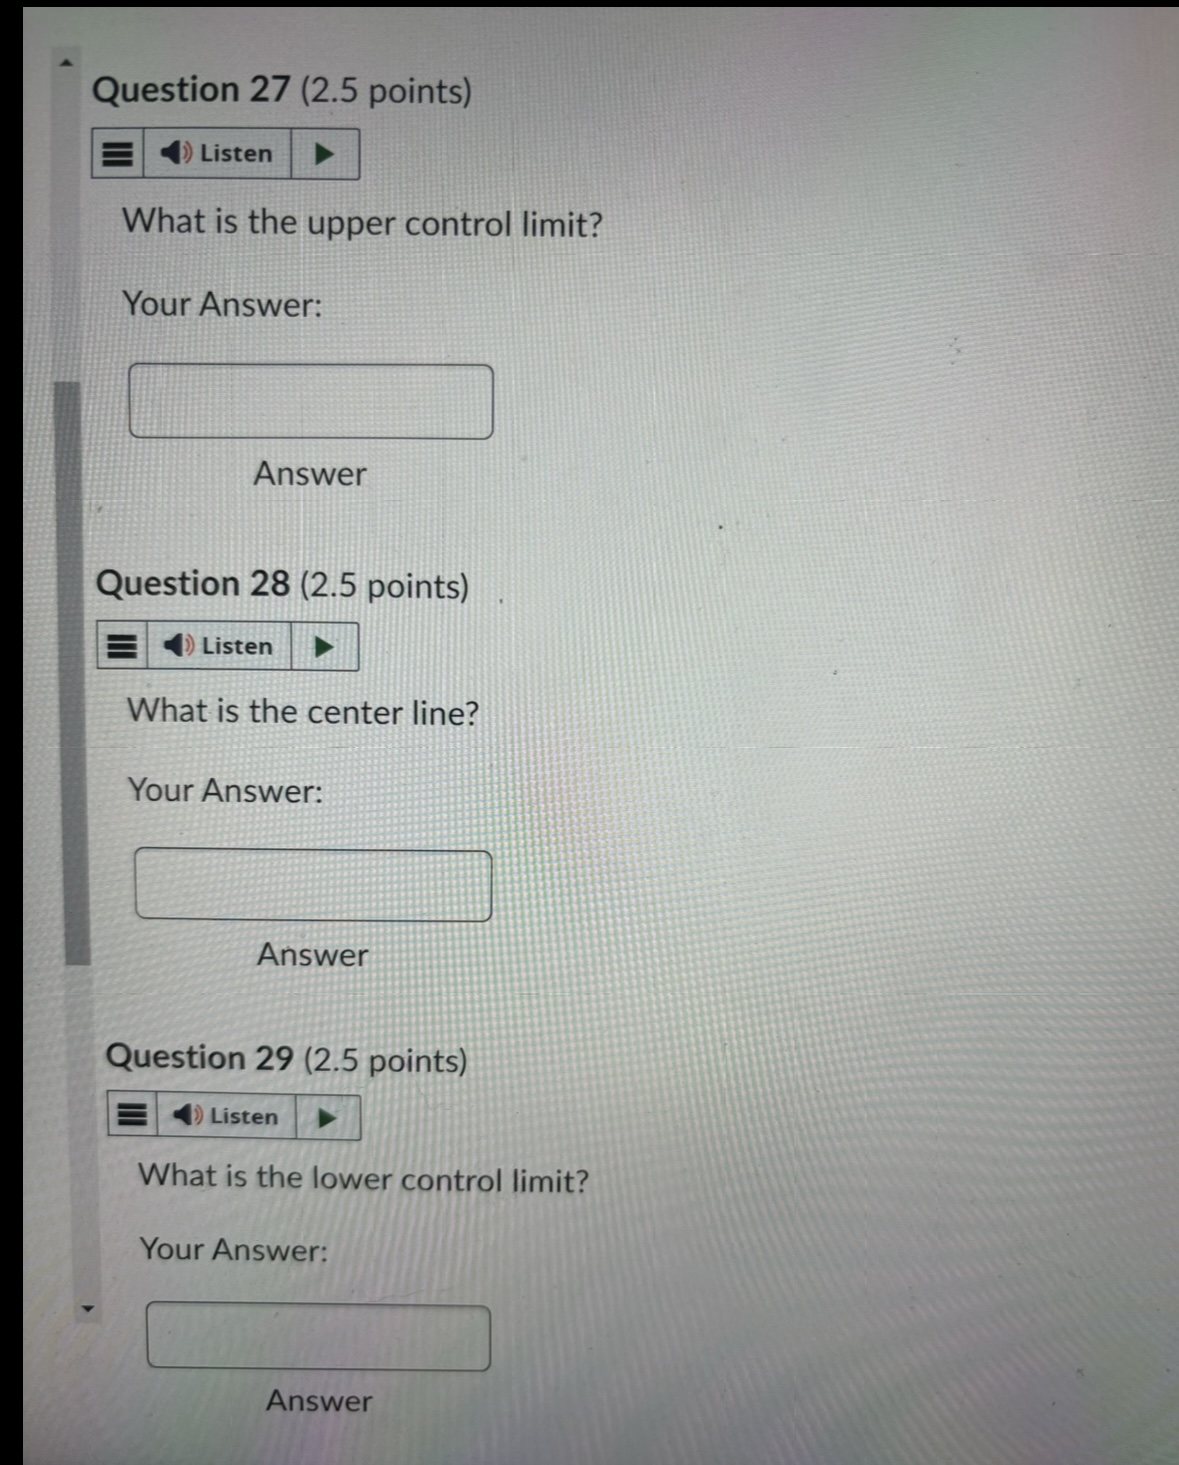
Use the information below to answer the next 9 questions. A quality inspector took six samples, each with twenty observations, of the weight of a bagging process, in pounds. The sample means and ranges are shown below. Use this information to obtain a three-sigma X-bar control chart for the mean weight. Use that control chart to answer the questions below. Do not round intermediate calculations. Round your final answers to three decimal points. What is the center line? Your Answer: Answer Question 20 (2.5 points) What is the lower control limit? Your Answer: Use the information below to answer the next 9 questions. A quality inspector took six samples, each with twenty observations, of the weight of a bagging process, in pounds. The sample means and ranges are shown below. Use this information to obtain a three-sigma R-chart for the dispersion of the weight. Use that control chart to answer the questions below. Do not round intermediate calculations. Round your final answers to three decimal points. What is the upper control limit? Your Answer: Answer Question 28 ( 2.5 points) What is the center line? Your Answer: Answer Question 29 (2.5 points) What is the lower control limit? Your
Step by Step Solution
There are 3 Steps involved in it

Get step-by-step solutions from verified subject matter experts