

Question: I've no idea how to proceed. Below are the values. Revisit the case The professor selects a portfolio 1. Determine a distribution for each stock
 I've no idea how to proceed. Below are the values.
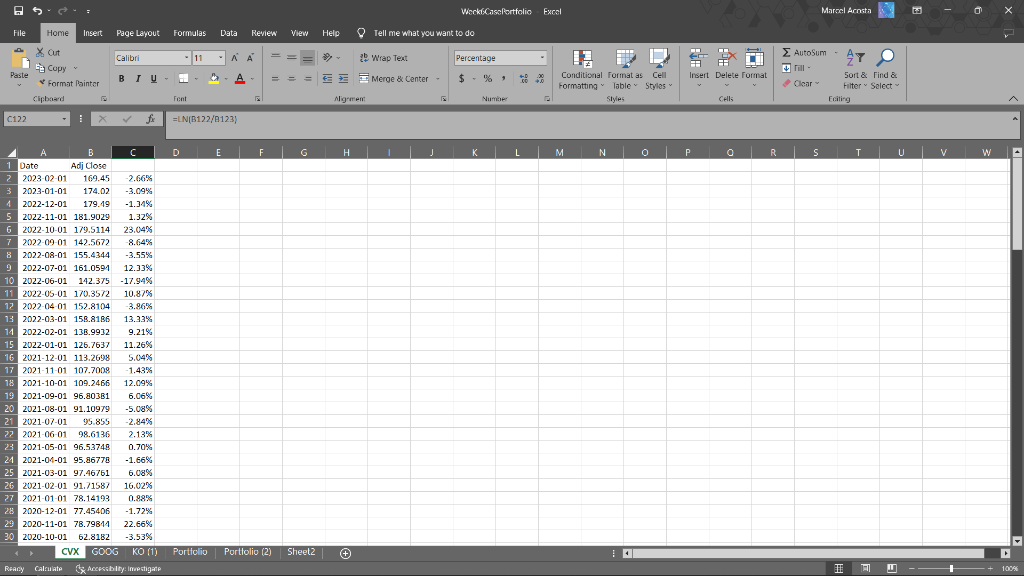
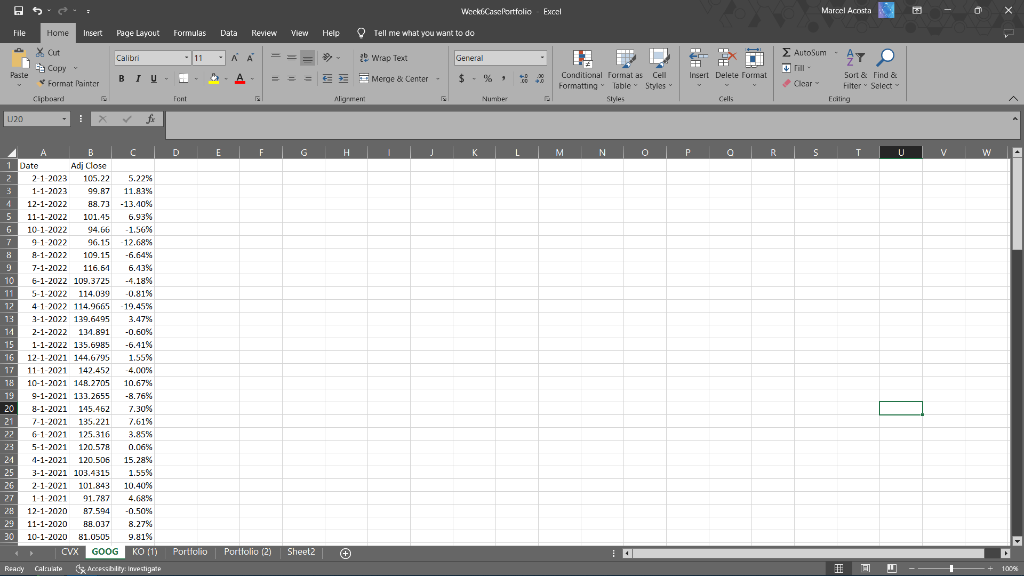
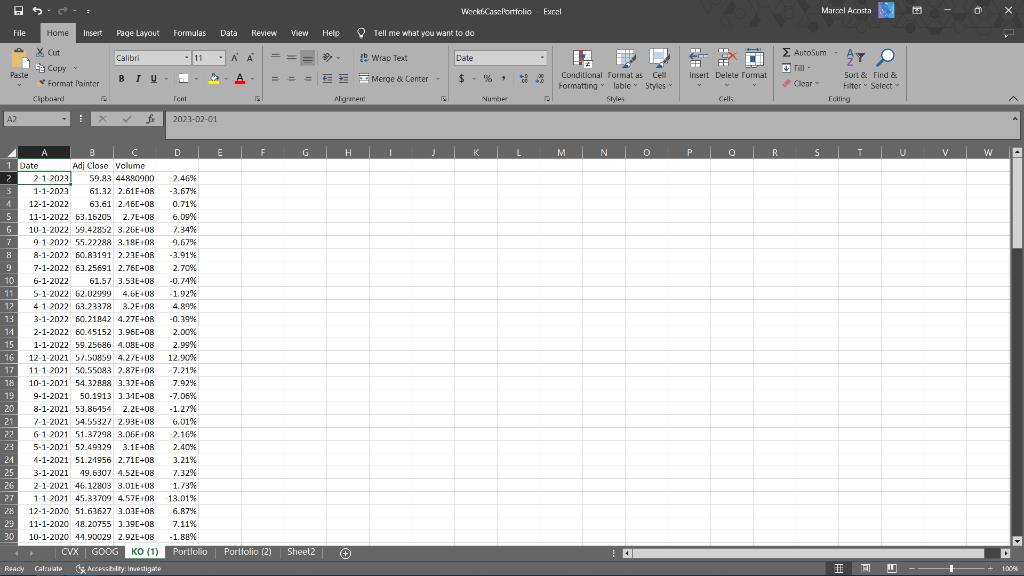
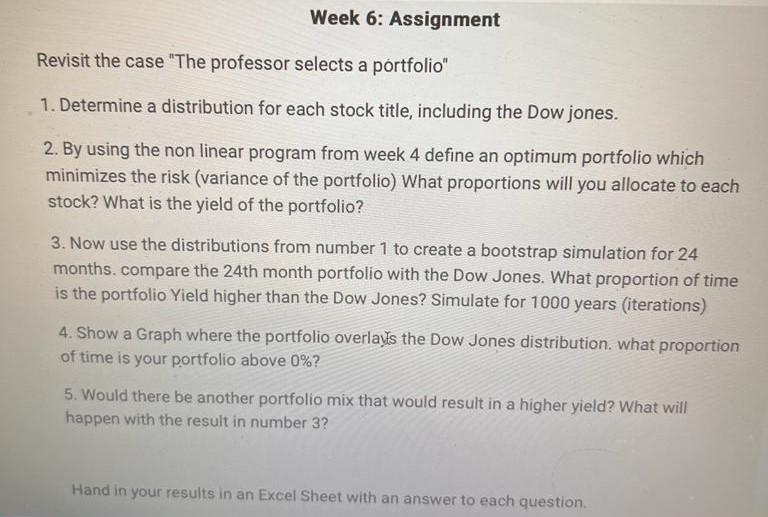
Revisit the case "The professor selects a portfolio" 1. Determine a distribution for each stock title, including the Dow jones. 2. By using the non linear program from week 4 define an optimum portfolio which minimizes the risk (variance of the portfolio) What proportions will you allocate to each stock? What is the yield of the portfolio? 3. Now use the distributions from number 1 to create a bootstrap simulation for 24 months. compare the 24 th month portfolio with the Dow Jones. What proportion of time is the portfolio Yield higher than the Dow Jones? Simulate for 1000 years (iterations) 4. Show a Graph where the portfolio overlay's the Dow Jones distribution. what proportion of time is your portfolio above 0% ? 5. Would there be another portfolio mix that would result in a higher yield? What will happen with the result in number 3 ? Hand in your results in an Excel Sheet with an answer to each question. Revisit the case "The professor selects a portfolio" 1. Determine a distribution for each stock title, including the Dow jones. 2. By using the non linear program from week 4 define an optimum portfolio which minimizes the risk (variance of the portfolio) What proportions will you allocate to each stock? What is the yield of the portfolio? 3. Now use the distributions from number 1 to create a bootstrap simulation for 24 months. compare the 24 th month portfolio with the Dow Jones. What proportion of time is the portfolio Yield higher than the Dow Jones? Simulate for 1000 years (iterations) 4. Show a Graph where the portfolio overlay's the Dow Jones distribution. what proportion of time is your portfolio above 0% ? 5. Would there be another portfolio mix that would result in a higher yield? What will happen with the result in number 3 ? Hand in your results in an Excel Sheet with an answer to each
Step by Step Solution
There are 3 Steps involved in it

Get step-by-step solutions from verified subject matter experts