

Question: i've posted this question earlier and the answer i got from here was wrong only the first one was right which I already got that
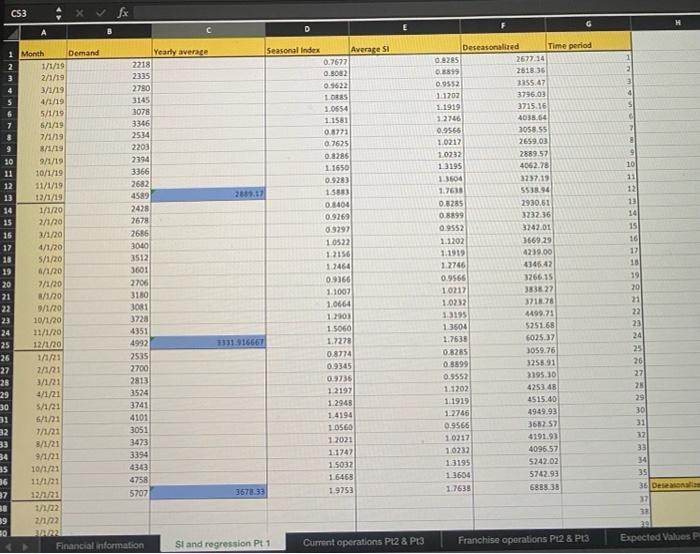
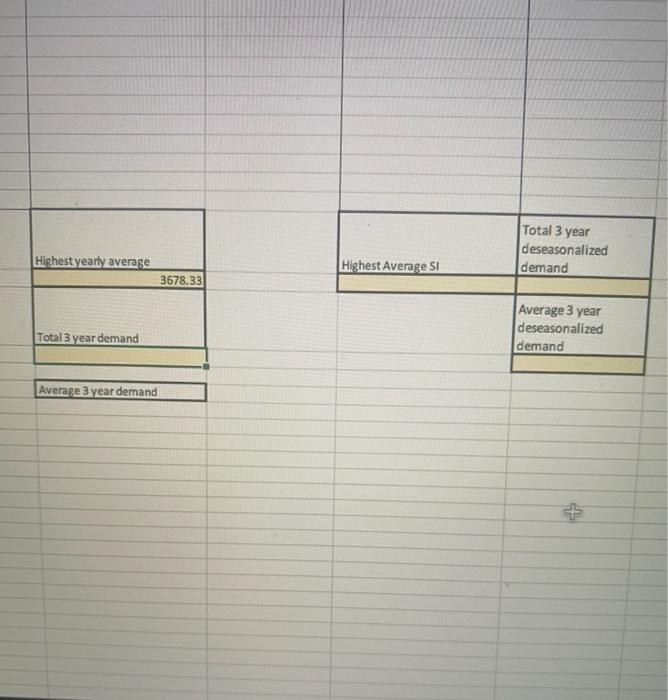

244 5 7 1 Month 10 11 ========= 12 13 14 15 CS3 15 17 18 19 20 21 22 23 24 25 26 27 28 29 30 31 32 33 34 35 36 37 31 39 30 32 1/1/19 2/1/19 3/1/19 4/1/19 5/1/19 6/1/19 7/1/19 8/1/19 9/1/19 10/1/19 11/1/19 12/1/19 1/1/20 2/1/20 3/1/20 4/1/20 5/1/20 6/1/20 7/1/20 8/1/20 9/1/20 10/1/20 11/1/20 12/1/20 1/1/21 2/1/21 3/1/21 4/1/21 5/1/21 6/1/21 7/1/21 8/1/21 9/1/21 10/1/21 11/1/21 12/1/21 1/1/22 2/1/22 312.02 Demand B 2218 2335 2780 3145 3078 3346 2534 2203 2394 3366 2682 4589 2428 2678 2686 3040 3512 3601 2706 3180 3081 3728 4351 4992 2535 2700 2813 3524 3741 4101 3051 3473 3394 4343 4758 5707 Financial information C Yearly average 2889.17 3331.916667 3678.33 D Seasonal Index Si and regression Pt 1 0.7677 0.8082 0.9622 1.0885 1.0654 1.1581 0.8771 0.7625 0.8286 1.1650 Average St 0.9283 15883 0.8404 0.9269 0.9297 1.0522 1.2156 1.2464 0.9366 1.1007) 1.0664 1.2903 1.5060 1.7278 0.8774 0.9345 0.9736 1.2197 1.2948 1.4194 1.0560 1.2021 1:1747 1.5032 1.6468 1.9753 Current operations Pt2 & Pt3 0.8285 0.8899 0.9552 1.1202 1.1919 12746 0.9566 1.0217 Deseasonalized 1.0232 1.3195 1.3604 1.7638 0.8285 0.8899 0.9552 1.1202 1.1919 1.2746 0.9566 1:0217 1.0232 1.3195 1.3504 1.7638 0.8285 0.8899 0.9552 1.1202) 1.1919 1.2746 0.9566 1.0217 1.0232 1.3195 1.3604 1.7638 2677.14 2818.36 Time period 3355.47 3796.03 3715.16 4038.64 3058.55 2659.03 2889.57 4062.78 3237.19 5538.94 2930.61 3232.36 3242.01 3669.29 4239.00 4346.42 3266.15 3838.27 3718.78 4499.71 5251.68 6025.37 3059.76 3258.91 3395.30 4253,48 4515.40 4949.93 3682 57 4191.93 4096.57 5242.02 5742.93 6888.38 Franchise operations Pt2 & P13 1 e 7 8 9 10 11 12 13 14 15 16 17 18 19 20 21 22 23 24 25 26 27 28 29 30 31 32 33 34 35 36 Deseasonaliam 37 38 39 Expected Values Pr Highest yearly average Total 3 year demand Average 3 year demand 3678.33 Highest Average Sl Total 3 year deseasonalized demand Average 3 year deseasonalized demand Show full question Expert answer F Expert in Finance Highest yearly average=3678.33 Highest average Sl=1.7636 Total 3years deseasonalized demand=143402.98 Average 3years deseasonalized demand=47800.9933 Toral 3 years demand= 118693 Average 3 years demand= 39597.667 Was this answer helpful? 0 0 244 5 7 1 Month 10 11 ========= 12 13 14 15 CS3 15 17 18 19 20 21 22 23 24 25 26 27 28 29 30 31 32 33 34 35 36 37 31 39 30 32 1/1/19 2/1/19 3/1/19 4/1/19 5/1/19 6/1/19 7/1/19 8/1/19 9/1/19 10/1/19 11/1/19 12/1/19 1/1/20 2/1/20 3/1/20 4/1/20 5/1/20 6/1/20 7/1/20 8/1/20 9/1/20 10/1/20 11/1/20 12/1/20 1/1/21 2/1/21 3/1/21 4/1/21 5/1/21 6/1/21 7/1/21 8/1/21 9/1/21 10/1/21 11/1/21 12/1/21 1/1/22 2/1/22 312.02 Demand B 2218 2335 2780 3145 3078 3346 2534 2203 2394 3366 2682 4589 2428 2678 2686 3040 3512 3601 2706 3180 3081 3728 4351 4992 2535 2700 2813 3524 3741 4101 3051 3473 3394 4343 4758 5707 Financial information C Yearly average 2889.17 3331.916667 3678.33 D Seasonal Index Si and regression Pt 1 0.7677 0.8082 0.9622 1.0885 1.0654 1.1581 0.8771 0.7625 0.8286 1.1650 Average St 0.9283 15883 0.8404 0.9269 0.9297 1.0522 1.2156 1.2464 0.9366 1.1007) 1.0664 1.2903 1.5060 1.7278 0.8774 0.9345 0.9736 1.2197 1.2948 1.4194 1.0560 1.2021 1:1747 1.5032 1.6468 1.9753 Current operations Pt2 & Pt3 0.8285 0.8899 0.9552 1.1202 1.1919 12746 0.9566 1.0217 Deseasonalized 1.0232 1.3195 1.3604 1.7638 0.8285 0.8899 0.9552 1.1202 1.1919 1.2746 0.9566 1:0217 1.0232 1.3195 1.3504 1.7638 0.8285 0.8899 0.9552 1.1202) 1.1919 1.2746 0.9566 1.0217 1.0232 1.3195 1.3604 1.7638 2677.14 2818.36 Time period 3355.47 3796.03 3715.16 4038.64 3058.55 2659.03 2889.57 4062.78 3237.19 5538.94 2930.61 3232.36 3242.01 3669.29 4239.00 4346.42 3266.15 3838.27 3718.78 4499.71 5251.68 6025.37 3059.76 3258.91 3395.30 4253,48 4515.40 4949.93 3682 57 4191.93 4096.57 5242.02 5742.93 6888.38 Franchise operations Pt2 & P13 1 e 7 8 9 10 11 12 13 14 15 16 17 18 19 20 21 22 23 24 25 26 27 28 29 30 31 32 33 34 35 36 Deseasonaliam 37 38 39 Expected Values Pr Highest yearly average Total 3 year demand Average 3 year demand 3678.33 Highest Average Sl Total 3 year deseasonalized demand Average 3 year deseasonalized demand Show full question Expert answer F Expert in Finance Highest yearly average=3678.33 Highest average Sl=1.7636 Total 3years deseasonalized demand=143402.98 Average 3years deseasonalized demand=47800.9933 Toral 3 years demand= 118693 Average 3 years demand= 39597.667 Was this answer helpful? 0 0
Step by Step Solution
There are 3 Steps involved in it

Get step-by-step solutions from verified subject matter experts