

Question: I've submitted these questions individually but they needed the data in the rest of the document. Thank you in advance for your help. Calling Heads
I've submitted these questions individually but they needed the data in the rest of the document. Thank you in advance for your help.
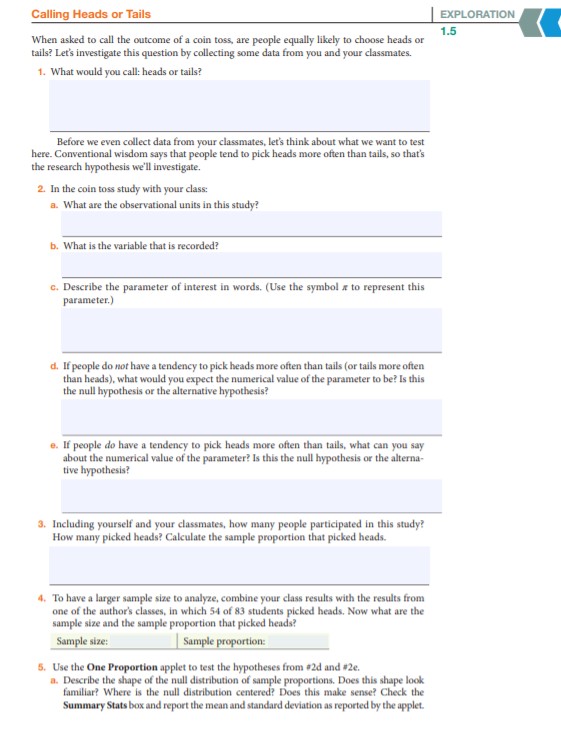
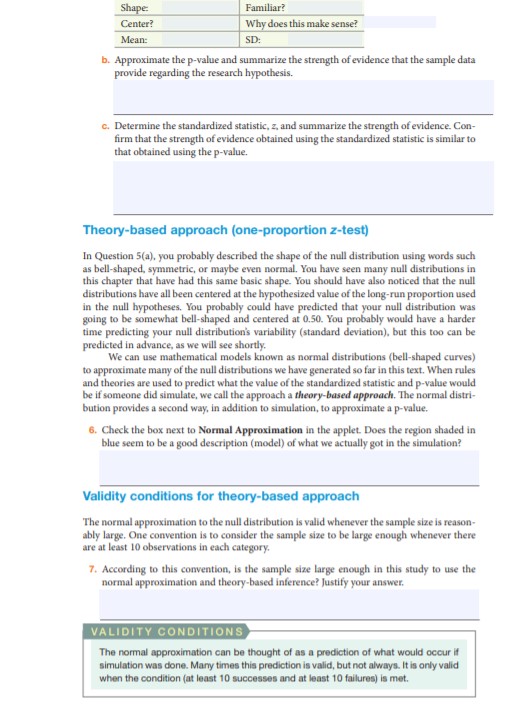
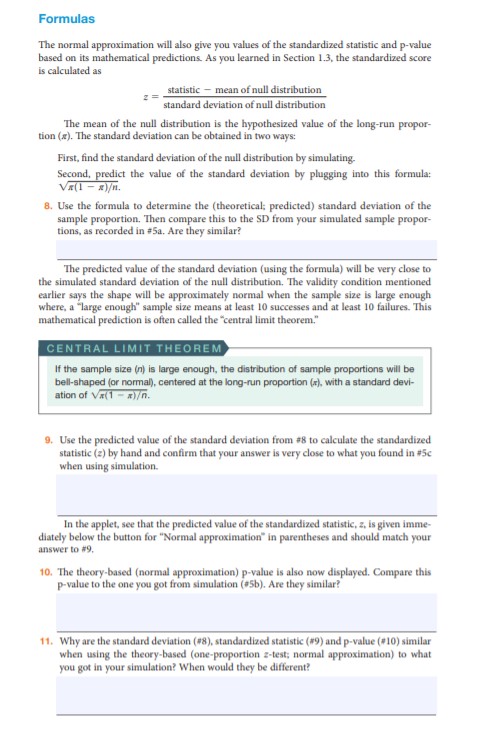
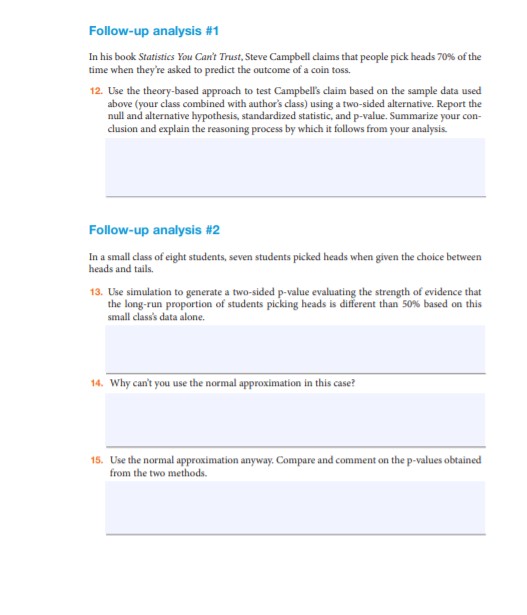
Calling Heads or Tails EXPLORATION When asked to call the outcome of a coin toss, are people equally likely to choose heads or 1.5 tails? Let's investigate this question by collecting some data from you and your classmates. 1. What would you call: heads or tails? Before we even collect data from your classmates, let's think about what we want to test here. Conventional wisdom says that people tend to pick heads more often than tails, so that's the research hypothesis we'll investigate. 2. In the coin toss study with your class: a. What are the observational units in this study? b. What is the variable that is recorded? C. Describe the parameter of interest in words. (Use the symbol a to represent this parameter.) d. If people do not have a tendency to pick heads more often than tails (or tails more often than heads), what would you expect the numerical value of the parameter to be! Is this the null hypothesis or the alternative hypothesis? e. If people do have a tendency to pick heads more often than tails, what can you say about the numerical value of the parameter? Is this the null hypothesis or the alterna- tive hypothesis? 3. Including yourself and your classmates, how many people participated in this study? How many picked heads? Calculate the sample proportion that picked heads. . To have a larger sample size to analyze, combine your class results with the results from one of the author's classes, in which 54 of 83 students picked heads. Now what are the sample size and the sample proportion that picked heads? Sample size: Sample proportion: 5. Use the One Proportion applet to test the hypotheses from #2d and #2c. a. Describe the shape of the null distribution of sample proportions. Does this shape look familiar? Where is the null distribution centered? Does this make sense? Check the Summary Stats box and report the mean and standard deviation as reported by the applet.Shape: Familiar? Center? Why does this make sense? Mean: SD: b. Approximate the p-value and summarize the strength of evidence that the sample data provide regarding the research hypothesis. C. Determine the standardized statistic, z, and summarize the strength of evidence. Con- firm that the strength of evidence obtained using the standardized statistic is similar to that obtained using the p-value. Theory-based approach (one-proportion z-test) In Question 5(a), you probably described the shape of the null distribution using words such as bell-shaped, symmetric, or maybe even normal. You have seen many null distributions in this chapter that have had this same basic shape. You should have also noticed that the null distributions have all been centered at the hypothesized value of the long-run proportion used in the null hypotheses. You probably could have predicted that your null distribution was going to be somewhat bell-shaped and centered at 0.50. You probably would have a harder time predicting your null distribution's variability (standard deviation), but this too can be predicted in advance, as we will see shortly. We can use mathematical models known as normal distributions (bell-shaped curves) to approximate many of the null distributions we have generated so far in this text. When rules and theories are used to predict what the value of the standardized statistic and p-value would be if someone did simulate, we call the approach a theory-based approach. The normal distri- bution provides a second way, in addition to simulation, to approximate a p-value. 6. Check the box next to Normal Approximation in the applet. Does the region shaded in blue seem to be a good description (model) of what we actually got in the simulation? Validity conditions for theory-based approach The normal approximation to the null distribution is valid whenever the sample size is reason- ably large. One convention is to consider the sample size to be large enough whenever there are at least 10 observations in each category. 7. According to this convention, is the sample size large enough in this study to use the normal approximation and theory-based inference! Justify your answer. VALIDITY CONDITIONS The normal approximation can be thought of as a prediction of what would occur if simulation was done. Many times this prediction is valid, but not always. It is only valid when the condition (at least 10 successes and at least 10 failures) is met.Formulas The normal approximation will also give you values of the standardized statistic and p-value based on its mathematical predictions. As you learned in Section 1.3, the standardized score is calculated as 2 = statistic - mean of null distribution standard deviation of null distribution The mean of the null distribution is the hypothesized value of the long-run propor- tion (#). The standard deviation can be obtained in two ways: First, find the standard deviation of the null distribution by simulating. Second, predict the value of the standard deviation by plugging into this formula; Vall - 2). B. Use the formula to determine the (theoretical; predicted) standard deviation of the sample proportion. Then compare this to the SD from your simulated sample propor- tions, as recorded in #5a. Are they similar? The predicted value of the standard deviation (using the formula) will be very close to the simulated standard deviation of the null distribution. The validity condition mentioned earlier says the shape will be approximately normal when the sample size is large enough where, a "large enough" sample size means at least 10 successes and at least 10 failures. This mathematical prediction is often called the "central limit theorem." CENTRAL LIMIT THEOREM If the sample size (n) is large enough, the distribution of sample proportions will be bell-shaped (or normal), centered at the long-run proportion (x), with a standard devi- ation of Va(1 - x). 9. Use the predicted value of the standard deviation from #8 to calculate the standardized statistic (z) by hand and confirm that your answer is very close to what you found in #5c when using simulation. In the applet, see that the predicted value of the standardized statistic, z, is given imme- diately below the button for "Normal approximation" in parentheses and should match your answer to #9. 10. The theory-based (normal approximation) p-value is also now displayed. Compare this p-value to the one you got from simulation (#5b). Are they similar! 11. Why are the standard deviation (#8), standardized statistic (#9) and p-value (#10) similar when using the theory-based (one-proportion z-test; normal approximation) to what you got in your simulation? When would they be different?Follow-up analysis #1 In his book Statistics You Can't Trust, Steve Campbell claims that people pick heads 70% of the time when they're asked to predict the outcome of a coin toss. 12. Use the theory-based approach to test Campbell's claim based on the sample data used above (your class combined with author's class) using a two-sided alternative. Report the null and alternative hypothesis, standardized statistic, and p-value. Summarize your con- clusion and explain the reasoning process by which it follows from your analysis. Follow-up analysis #2 In a small class of eight students, seven students picked heads when given the choice between heads and tails. 13. Use simulation to generate a two-sided p-value evaluating the strength of evidence that the long-run proportion of students picking heads is different than 50% based on this small class's data alone. 14. Why can't you use the normal approximation in this case? 15. Use the normal approximation anyway. Compare and comment on the p-values obtained from the two methods
Step by Step Solution
There are 3 Steps involved in it

Get step-by-step solutions from verified subject matter experts